Bearish divergence at resistance for BPBP has rallied into resistance at around the 500p level. This is probably a call to take a bit of profit rather than initiate a speculative short. Medium to Long term we are a fan of the oil majors.
BPE5 trade ideas

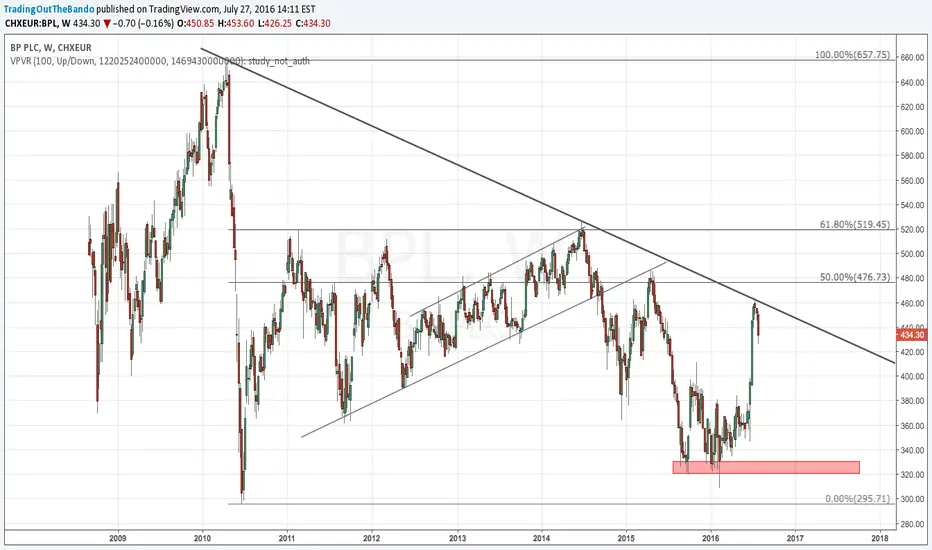
BP could revisit last week’s lowFailure to hold above the rising trend line amid the bearish price RSI divergence on the weekly chart and a bearish crossover on the weekly MACD suggests potential for a sell-off to last week’s low of 432.15.
On the higher side, only a weekly close back above the rising trend line would signal short-term bearish invalidation.

THINK BP!Now may be a good time to start acumalating shares of BP. It has been trading between 31.57 and 37.53 for quite some time and is near the lower end of the range. If I were to guess, there will be a final buying opportunity at the end of the year. 11/11 B$ close

BP:Bullish Bat PatternPlan to buy BP based on the bullish Bat pattern and previous structure.
Entry is 33.4
SL below 33
TP1:35
TP2:36.3 and further more


BP Cup & Handle Pattern Breakout?Looking at BP back to November of 2015 to now....looks like a cup and handle pattern is really starting to take form here. Anyone else seeing this or think otherwise?

BP is rejecting at a channel high with pattern4 hour large Bear candle forming at projected channel resistance with throw-over.
Flat pattern labeled abc up potential completion.
Trigger short on a strong move lower at 34.30 with target into 31.25.
Initial stop above the wave c high at 36.31.
Follow it through into 29 or below if 3rd wave develops.


BP ResumesBP has been steadily going up since February and right now is a pretty good entry point. It has consolidated off its highs of 37 and the daily 8 day ema crossed over into positive territory today. Weekly support is at 31.57 and major resistance is at 37.53. 8/18 after close


BP in troubleWe have seen a large fall in BP prices for a very long time. long standing trend line very much in play going down and its just come off another touch.
BP price has respected the technicals very well retracing into the 61 level falling off then retracing into the 50 and falling off before retracing into the trend line again.
looking to see a test of the 320 area now
BP: The recovery is near...BP approves final investment decision on $8B Indonesian LNG project
7% dividend

Shorting BP pre-earningsBP has been slowly moving up with the price of oil since April. This has not yet destroyed the long term bearish momentum on the Monthly timeframe where the downward trend is still intact. Price has now gotten to the top of the Weekly cloud to contain the overall long term bearish trend. At this point it's a "line in the sand" to determine long term sentiment going into this quarter. I'm taking a pre-earnings play with October 33 Puts. I'm targeting the next major support at 31.55 by before September to get out before theta decay kicks in.

pennies to thousands high put activitystock fails in 31 area three times macd and relative strength weak stoc turned south cloud is thin east to pierce gap down close to 50 day ma


BP(Daily) - Inverse HS potential-Double bottom.BP(Daily) Inverse HS potential, double bottom.
Inverse HS potential brake_out.
Double bottom brake_out confirmed, 26.18 retest.
Gap Fill.
Long on retest of Neckline(after potential AB=CD), or on new high.
OBV set to brake_out.
Earnings due 28/4.
Target_1 : 44
Target_2 : 46.50

May be on its way down$BP completed a bearish Bat two weeks ago.. This was an Elite Zone setup
The first reaction was a quick hit on our first target level, but than the stock rallied back up and spent almost two weeks jumping around the PRZ.
On Thursday and Friday, we finally got the move I was expecting and it seems like $BP may be on its way down to test the 38$ zone... (must pass 40$ on its way down)

BP - Multi decade support (excluding 2008)These levels had been first seen in 1997. Will these levels hold? Or the Oil prices are going further down and BP will get even cheaper? I am watching but will definitely buy on any sign of strength. This is definitely a value investment with a dividend yield of more than 6%


BP P.L.C. - BP - Daily - Down to Key Support - $2.50 upsideOversold on news to old support.
Tim 12:05PM EST Tuesday, Sep 9, 2014
