CAT Short - Caterpillar, Inc. - The Double Top DropNYSE:CAT Short - Caterpillar, Inc. - The Double Top Drop
This short biased thesis is based on the following factors:
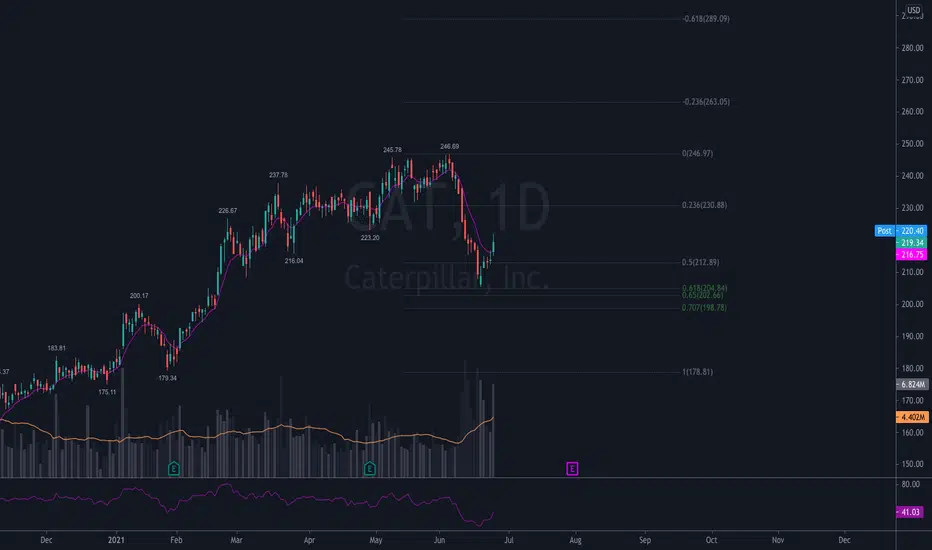
A double top that was recently formed and confirmed
A Bearish Three Black Crows candle stick pattern followed the second top (of the double top)
A large series of dark pool prints totaling around $882M came in on June 25th, all around the $216.31 price level. Although we do not know the nature of this trade, we are currently trading under this level and continued downside price action will further increased the probability that this trade was a sell.
Possible Threats:
The $212.62 fib defined level may show support where price action may struggle or bounce from.
Short term tactical sentiment for XLI is starting to recover from a bearish downtrend and may show upward momentum from here that could lift CAT up enough to hit the Stop Loss.
That nature of the large dark pool trades are unknown and can only be inferred.
The June 29 Bar is being used to define the following trade parameters:
Short Entry: $214.58
Stop Loss: $218.71
Possible Targets:
$207 - First meaningful fib level
$200.17 - A previous trend high that was used as a fib definition point
$197 - Based on a fib level that has show to have acted as reasonable resistance and support
$190 - Based on the rounding to a whole number on the closest fib level
Other targets can be based on the fib levels show in the chart or by drawing support lines
This thesis/idea is just my opinion based on the information discussed within. None of it should be looked as a recommendation or as financial advice.
NYSE:CAT Daily Chart
NYSE:CAT Weekly Chart
CAT1 trade ideas


CAT - Long (fixed)pretty straight forward here - infrastructure bill play. retrace back to golden pocket $235 area, and then we see. Target $235, $245, and $263
CAT - Longpretty straight forward here - infrastructure bill play. retrace back to golden pocket, $235 area, and then we see.

wave A down has ended look for new highs We have just bottomed in wave A at a perfect .618 we will now see a wave B to above 250 by late july wave C CRASH SEPT TO OCT I am net long calls in cat de hd low cost pg now

boomer stock do or die will the trendline hold or will this boomer stock face a possible grind to goblin town. long

$CAT Trade Idea$CAT Trade Idea
$CAT consolidating at the lows of the recent pullback forming a double inside day pattern.
Above 221 with Market Strength, the 6/25 225c can work targeting 224,226, and 229.
Under 216 the 6/25 215p can work targeting 213, and 210.
@TradingView
@KyleTrades86

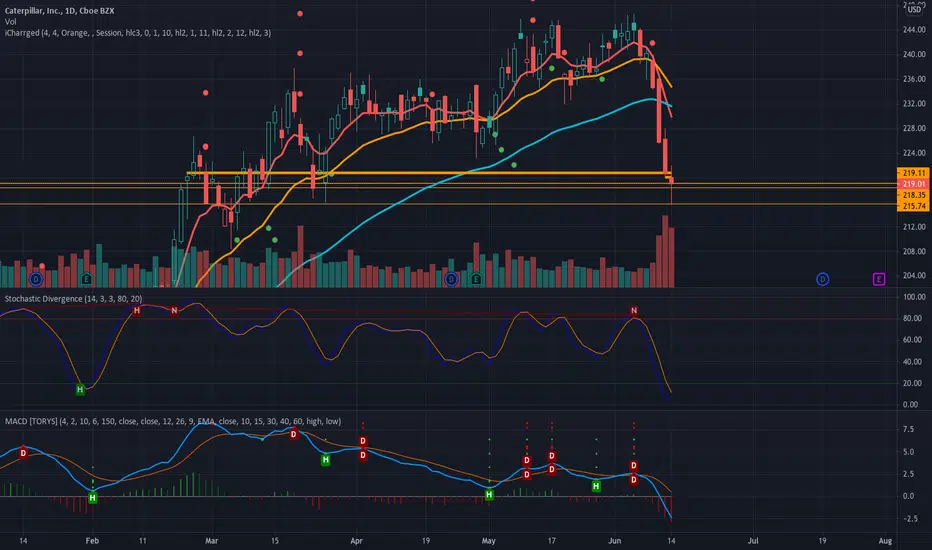
Caterpillar Is OversoldCaterpillar was one of the favorite value / cyclical plays coming out of 2020’s mini-depression. Now, the Dow Jones Industrial Average member just had its biggest pullback in a long time.
This chart highlights the deeply oversold condition on stochastics, which fell on Monday to their lowest level in over a year. CAT also just had its worst week (-9.6%) since the depths of the coronavirus crash in March 2020:
The main catalyst for the selloff appears to be the failure of a high-dollar bipartisan infrastructure bill in Congress. However, there were signs of trouble on the chart – especially the bearish divergence on MACD.
However now that a liquidation has occurred, bulls may like the chart. Aside from the oversold stochastics, CAT is holding the March 2021 low around $216. Will this level become support again?
Given the sharpness of the drop and the high volume, it may still be early in the process to jump into CAT. However, it remains one of the most important cyclicals / industrials in the market. Potential buyers may start getting interested – especially with a new quarter getting close.
TradeStation is a pioneer in the trading industry, providing access to stocks, options, futures and cryptocurrencies. See our Overview for more.

Long - CATCAT gives a early entry here after having 2 reversal candles into a support area and exhausting volume.
Pros:
2 reversal candles
exhausting volume
rejection of support area
good Risk Reward Ratio
Con:
no confirmation


CATThis stock was dropped of heavily, drew some resistance lines, great opportunity to buy, but I would wait until blue stochastic line crosses above the orange stochastic line.
Another "buy the dip" trading idea! 😁Another “buy the dip” trade, just like our idea on DE. The principle is exactly the same, but with a few more details.
We have a rounded bottom, and the RSI is extremely divergent, indicating a possible rally.
In the 4h chart, the RSI is at 23, and we did break the BB today, but we closed inside it in the end. Like this wasn’t enough, we are above a support at 216 area.
A rally could make it hit the 231, but CAT must do the movement quickly, or it’ll lose momentum. It must not lose the 216 again, or it might keep dropping.
If you liked this trading idea, remember to click on the “Follow” button to get more trading ideas like this, and if you agree with me, click on the “Agree” button 😉.
See you soon,
Melissa.

Dead CAT bounce opportunity?CAT is in an obvious bear market and should head lower after breaking below the 100SMA. So it will continue to head lower. I believe this is was a sell the rumor on the Biden Infrastructure plan to shake out investors who jumped in.
I'm targeting the Fib retracement level at 209.12 for a buying opportunity. There is also support from the 150SMA on the daily. Indicators on the daily currently are going into oversold conditions and will watch for RSI bullish divergence. I'm looking at this as an ABC corrective wave with the rebound taking it back to 234. Could be a good swing trade.
A break below the 150 SMA would retrace it down to the 200SMA or the 2nd FIb retracement level at around 186.

CAT This is coming into the slingshot like Gold did several weeks ago. Looking for the red line to get below 20 on the Slow S and get a reversal pattern.. first target will be back to the daily wave

CAT is heading to 10% increase in one weekCAT just in a reversal phase and heading to 10% increase so soon NYSE:CAT

$CAT Trade Idea$CAT Trade Idea
Entry: 245
Strike: 6/11 250c
Targets: 249, 252, 255
Support: 241, 238, 235
@TradingView
@KyleTrades86


CAT LONGVery stable climbing through the year and last months moved from "first floor" to "second floor" of the channel.


CAT - GREAT Buy Opportunity, IF ... !!!Hello! Friends,
-This would be a great Buy Opportunity, IF NYSE:CAT breaks up the Daily Resistance line at $233.50 (with a WHOLE DAILY Candle) !!

Needs to cool off. Down to $232CNBC might say its a buy. And it is but not yet. Patience is key. Made nice paper buying 5/21 puts this week

Ascending triangle on CatNice and clean ascending triangle or even bull flag however you want to look at it. Plus if that 2 trillion infarstructure bill gets passed guess what will build all those new roads and stuff. CAT!!!! 280 is first price target.

