What cash secured puts look like when it goes the wrong wayMost people promote cash secured puts as being a fool proof way to make money and I believe 80% of it because there are events such as this that doesn't get published much in trading schools or learning materials
With such a high win rate associated with selling puts, its easy to think you will never ever get assigned or lose a trade.
But this is the exact time when traders can get burnt, is that they chase a company without regard for the companies they are selling for, or even the tail risk that sometimes markets can correct like this
Whilst it is not constructive to look at this scenario as one that happens frequently, it is a way to look back in time and be humble about the market sometimes doing things we don't expect
Imagine at the time in the tech book, CSCO was touted as the king of the tech world and it would change everything forever, only to see it burst in the next few months and wipe out all their gains. Prior to the crash you could have convinced yourself what an incredible company CSCO is and you wanted to own it via cash secured puts and take ownership of shares. Look how that would have turned out
If selling the 57$ puts allowed you to collect 4$/contract, look how long it would've taken to breakeven on your position. We can ignore the cost reduction from selling calls at the time because I think the frustration would've made you give up on managing the position.
The only way out would have been to average down and sell the next pop, or take a loss, or better yet - at the offset, not allocate such a huge amount of put contracts and take on more risk than your cash secured account could handle - but money and greed can make people do crazy things so its easy to look back now to avoid selling puts. When the news is saying we are ushering in the next wave of innovation, how can you not be apart of it - if you aren't apart of it then you are missing out. And what better way to be apart than to deploy a fancy options trading strategy to sound smarter than all your peers?
Sometimes companies we thought we wouldn't mind owning, turn out to be companies we actually want to divorce eventually. Much like how we sometimes select a partner for marriage thinking we can do this for 20 years. And after 5 years, yeahhhhh I don't know, I'm having second thoughts.
Ask anyone if they have the guts to marry anything, not just a person for even 5 years, I don't think people can plan commitments or imagine their lives 10 years out - in a span of 10 years, if you look at the world, we have had an explosion of iphones and social media - When I was young, we owned a tube TV and I grew up in the dial-up internet era!
Nowadays, 1-2 years is considered long term holding, not the same as 5-10 years. Trends change quickly and if you want to sell cash secured puts on "fundamentally sound" companies, you have to adapt quickly to the ever changing market conditions
CIS trade ideas


LHX, TOL, CSCO Here are a few names I have been watching, and today, I entered long positions. LHX, TOL, CSCO.

CSCO Bubble PatternFollowed a common 5 phase pattern
Phase 1: Trending breakout of basing formation in a strong up-trending move
Phase 2: Trending high-volatility drawdown (usually not related to stock or index itself).
Phase 3: Trending recovery - stock or index shrugs off the high volatility event as it recovers quickly and stronger than before.
Phase 4: Upwards & & sideways non-trending consolidation. Typically choppy trading, but slightly upward move.
Phase 5: 3 Phase blowoff top - breakout of non-trending consolidation followed by a smaller upwards consolidation into final blowoff breakout top.

$CSCO - love a megaphone patternThis stock has multiple strong indicators plus a megaphone pattern emerging.
One to watch for sure.

How To Turn $2k into $20kWe have a fantastic opportunity to end 2020 with a bang, and I am going to explain how you can turn $2k into $20k the final week of December. First I want to wish everyone a Merry Christmas and this post is my Christmas gift to you. We will either loose $2k together or make an $18k profit together. There is risk but in my opinion the reward is so significantly greater and likely. I am going through with it, and in the end it's your call. No pun intended.
CSCO recently received a buy signal on the Bollinger Bands, and has growing bullish divergence on the MACD, and D+.
With such strong divergence and CSCO being so close to breaking resistance, I believe we will see a break out and see the stock hit new highs.
My strategy is to buy 100 contracts ( calls ) for CSCO to hit $45 a share by 12/31
The contracts are currently trading for 0.19 a contract and I can see the contract value hitting a high of $2.00 a contract
I want to give all the credit to @avakstocks for finding this breakout opportunity after learning to use my technical analysis strategy.
This is a big opportunity and I ask that if you decide to make this power play and win big, to donate a small fraction like $50 worth of coins to @avakstocks to help fund his pro membership.
Comment your thoughts below, follow to see what happens, and make sure to like if you think this will happen!

Bought on saleIt's 50% off compared to its intrinsic value.
It could go down further, thus the stop. It's "risky".
Out of all the tech stocks I've looked at $ CSCO has the BEST fundamentals.
High growth potential.
You probably want to wait for when it goes back up or grab some call options.
I only bought a single share. So it could go to 0 I wouldn't cry about it.
The fundamentals are there. The price doesn't make sense this low.

~45.20 to complete X before down, maybe $26, on $CSCO Cisco~45.20 to complete X before down to $26 on $CSCO Cisco
posting this mostly bc i still don't knowhow to save properly and so i dont have to keep charting from scratch

CSCO Bullish Gap Cisco has snatched up a UK cloud software company, This could act as a bullish catalyst to help close this gap, along with the bullish momentum it is currently experiencing.

NASDAQ: CSCO / Cisco SystemsHi.
I'm OrdinariusTrader.
I'm The Best Trader In The World.
If you want new shares, you know what to do.
Like and follow.


Cisco- I will continue to hold longCup and handle formation has confirmed after prices had a strong breakaway gap, thus giving a strong confirmation of the upside by the pattern. Additionally, the target level of 161.8% extension has yet to be met. Hence, we are looking at the stock correcting to the nearby demand zone before edging upwards.

CSCO BullishCSCO tried to push against it's gap but was too bullish and started heading upwards. I believe this paints a bullish path for CSCO.


$CSCO a marginal bullish outlook following Earnings releaseThe PEAD is projecting a marginal bullish outlook for $CSCO after a positive under reaction following its earning release with the stock currently trading just above the median line of the projected PEAD cone.
If you would like to see the Drift for another stock please message us. Also click on the Like Button if this was useful and follow us or join us.
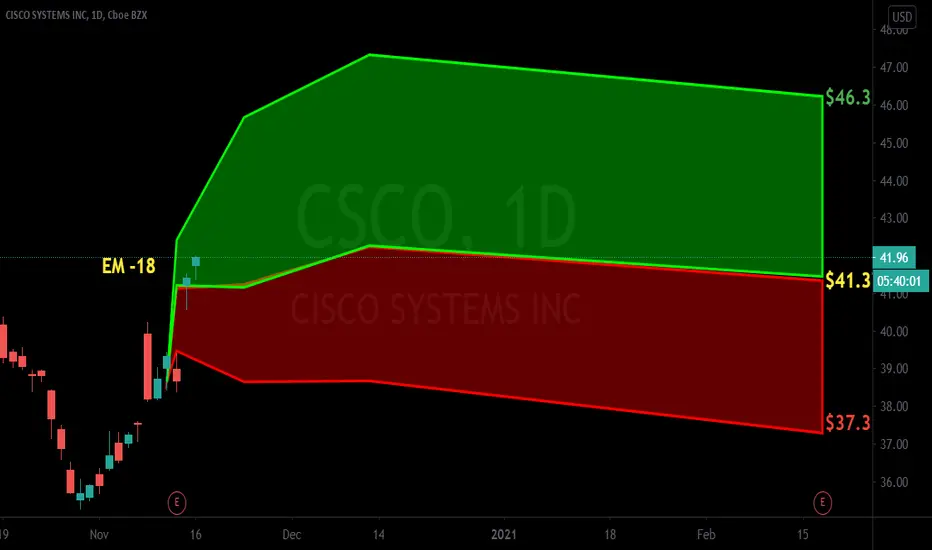


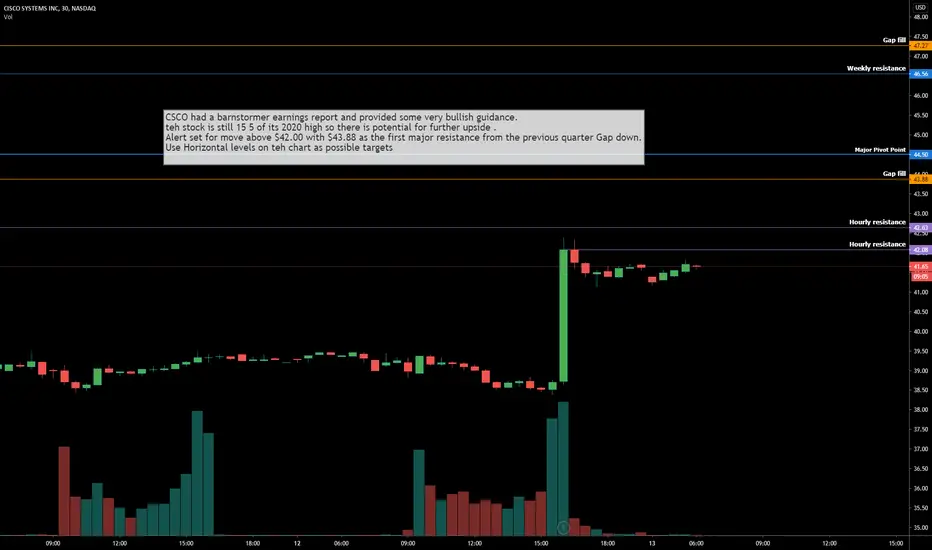
$CSCO Cisco Systems - Potential to fill Huge Gap on chart
CSCO had a barnstormer earnings report and provided some very bullish guidance.
teh stock is still 15 5 of its 2020 high so there is potential for further upside .
Alert set for move above $42.00 with $43.88 as the first major resistance from the previous quarter Gap down.
Use Horizontal levels on teh chart as possible targets
$CSCO EARNINGS BEAT! WILL WE RUN?Huge GAP on the daily? Ill breakdown what we gotta do to get there, and what that could looking like in options of equity
