Bullish CSCOHow about the 45.68 level for Christmas? That's the level to focus on for this move higher expected in the next couple weeks. Bullish CSCO.
CIS trade ideas

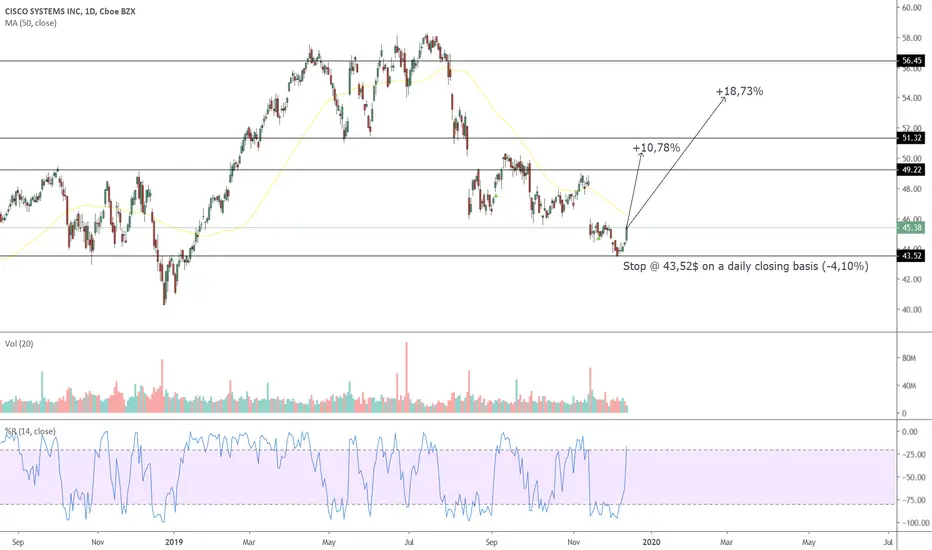
LONG CSCOExpecting bounce from extremely oversold weekly and daily levels. If stop breached, be prepared to catch new daily reversal on lower levels with a tight stop.
Diamond reversal pattern extended (update)Diamond pattern has extended. I left the old solid pink line, but added the new dashed pink line as the pattern extended. I also added inverted head and shoulders notations. Note the nested smaller fractal H&S of today and how it fits into the larger H&S of the past five days.
Again, CSCO is closely positively correlated with the overall NASDAQ. So barring a CSCO specific catalyst, the two are going to move in the same direction. I'm expecting the overall markets to continue their climb on Friday and thru the light volume Thanksgiving holiday.


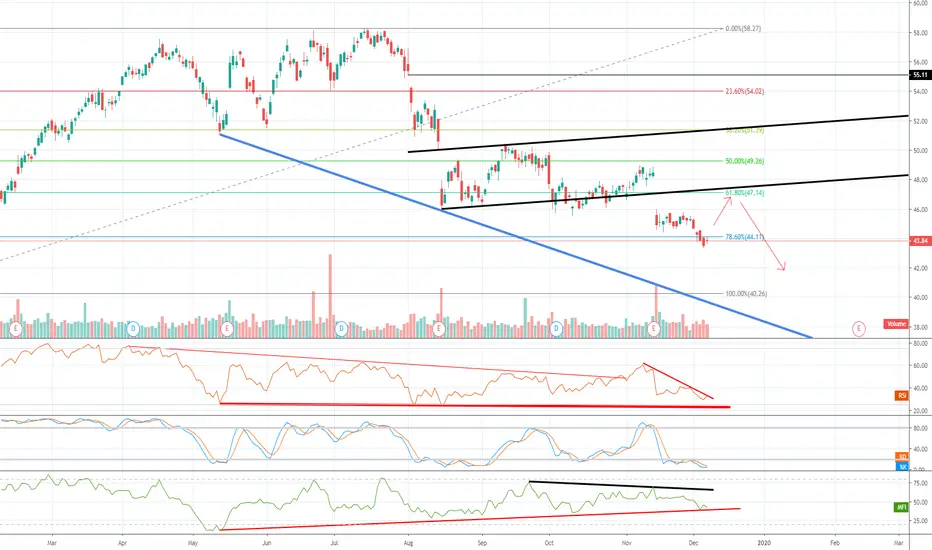
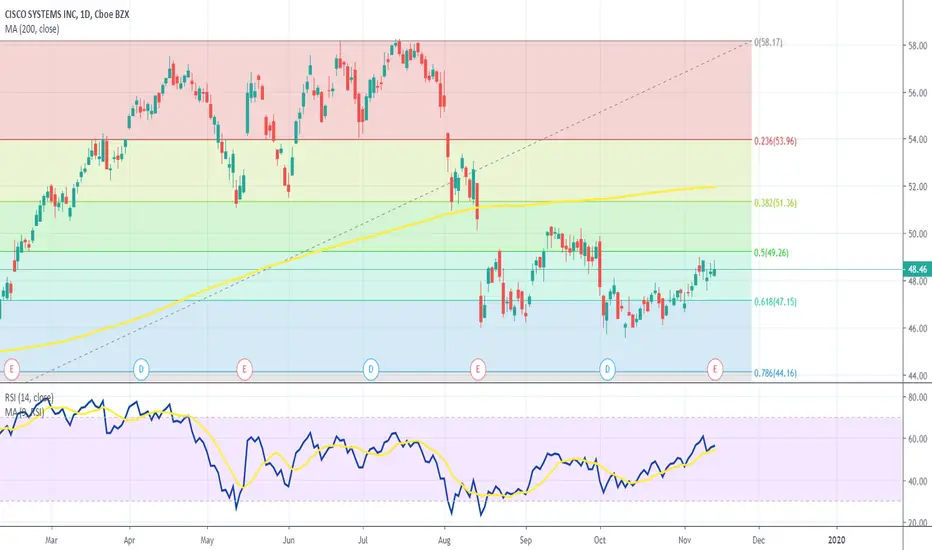
$CSCO possible bounce to 47 .5 then fall again to 41.5 BearishLong term down trend , currently almost over sold and expected bounce to 62% fibo near by 47.5 then continue falling to make lower low

Thoughts.
We should see this rebound near $40.
Optimal time to catch both a price move in this stock and dividends. .35 per share. per quarter.
Load upp

Cisco Systems, (CSCO - short) - swing trade ideaCisco Systems, Inc. (CSCO) broke support of the bearish pennant formed over the last 3 weeks and is likely to continue with a decline toward 43 areas.


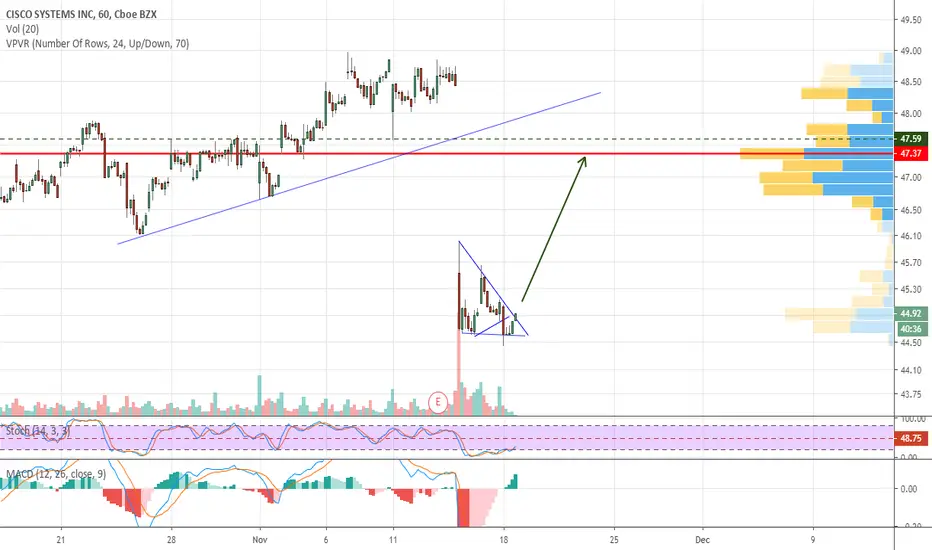
Building out diamond reversal pattern $CSCO 30 minute time frame, building out a diamond reversal pattern. Pull back today on below average volume. Looking for a breakout up tomorrow. Once it clears 46, look for a gap fill up to about $47.50. This may not move as fast as market momentum leaders, but it does pay a dividend and tracks the NASDAQ index very strongly. If you think the market is going up regardless, this makes a nice hybrid value/dividend/ tech play.

CSCOSystem T Performances: Annual Compound Profit 40%, Win Rate 55%, Risk/Reward Ratio 1:2, 20 Years of Backtesting Data, Over 100 Markets.
* Click Like and Follow to Support My Work!
---
Hi Traders,
I'd like to introduce the System T, a computerized trading system that analyzed and backtested the 20 years history data of over 100 markets.
This post is my sharing of how I think about systematic trading and the signals generated by the System T.
(This is my opinion only, NOT the financial advice.)
I think that for the system to open a trade and manage risk, it only needs a buy signal & a stop-loss signal clearly on the chart.
Once the system finds a good trend, it will ride it as long as possible. The stop-loss will be adjusted accordingly to the new price movement.
(Remember to follow this trade idea and follow my profile to get updates about the stop-loss adjustment and sell signal based on the latest price and market conditions daily.)
System T performances above will give you an idea of how it performs in the last 20 years.
Notice that this result was achieved only if I strictly followed the rule: "Only and Always Buy & Sell based on the System Signals".
Don't sell when there is no sell signal as we all want to follow the good trends til the end like everything in life does. \(^-^)/
Also, my system is extremely diversified through over 100 markets so that it only risks less than -1% of the total capital per trade.
Thank you and good luck!
---
DISCLAIMER:
I am NOT a financial advisor, and nothing I say is meant to be a recommendation to buy or sell any financial instrument.
My views are general in nature and I am not giving financial advice. You should not take my opinion as financial advice. This is my opinion only.
Do your own due diligence, and take 100% responsibility for your financial decisions.
Trading and investing are risky! Don't invest money you can't afford to lose, because many traders and investors lose money. There are no guarantees or certainties in trading.
- Content is for education purposes only, not investment advice.
- Trading involves a high degree of risk.
- We’re not investment or trading advisers.
- Nothing we say is a recommendation to buy or sell anything.
- There are no guarantees or certainties in trading.
- Many traders lose money. Don’t trade with money you can’t afford to lose.

LONG CSCOExpecting bounce from extremely oversold weekly and daily levels. If stop breached, be prepared to catch new daily reversal on lower levels with a tight stop.
Bull flag for the retracement/ back testOversold. Overall market is unstoppably bullish with the Fed's non QE POMO policy. Looking for a bounce up to about the 47.37 VBP line. I expect it up to $48 by next week.
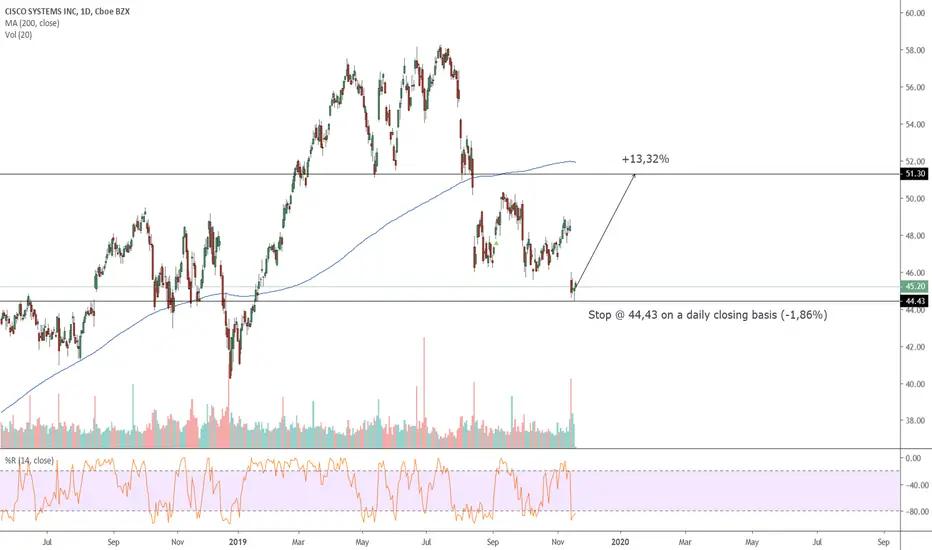
Cisco: Buy opportunity for 54.00.Cisco nose dived on last week's closing sessions with 1D turning aggressively bearish (RSI = 34.865, MACD = -0.320, Highs/Lows = -2.0286). The stock may be well below its July's High but there is a technical pattern that presents the current 45.00 level as an optimal medium term buy opportunity.
In 2012 we had a similar price action, which following a Death Cross on 1D, made a bottom on a symmetrical Higher Low Support and initiated the new multi-month buy sequence. We are on an identical price action at the moment and with the RSI hitting the same bounce level we believe Cisco is near a bottom (even symmetrical as seen on the chart). 54.00 appears to be a reasonable long target for the first months of 2020.
** If you like our free content follow our profile (www.tradingview.com) to get more daily ideas. **
Comments and likes are greatly appreciated.

Cisco long opportunityJust drew support and resistance levels and looks like it's a perfect time for opening long CSCO position.


CSCO Trade ZonesOrange is shorter term resistance zone
Red is longer time resistance zone
Yellow is shorter term support zone
Greens are longer term support zone
Orange/red zones are good exit ranges for longs, or short entry zones.
Yellow/Greens are good entry points for longs, or short targets.
Theres a lot of trade possibilities off these levels here but a lot of it depends on how it plays out going forward.

CSCOSystem T Performances: Annual Compound Profit 40%, Win Rate 55%, Risk/Reward Ratio 1:2, 20 Years of Backtesting Data, Over 100 Markets.
* Click Like and Follow to Support My Work!
---
Hi Traders,
I'd like to introduce the System T, a computerized trading system that analyzed and backtested the 20 years history data of over 100 markets.
This post is my sharing of how I think about systematic trading and the signals generated by the System T.
(This is my opinion only, NOT the financial advice.)
I think that for the system to open a trade and manage risk, it only needs a buy signal & a stop-loss signal clearly on the chart.
Once the system finds a good trend, it will ride it as long as possible. The stop-loss will be adjusted accordingly to the new price movement.
(Remember to follow this trade idea and follow my profile to get updates about the stop-loss adjustment and sell signal based on the latest price and market conditions daily.)
System T performances above will give you an idea of how it performs in the last 20 years.
Notice that this result was achieved only if I strictly followed the rule: "Only and Always Buy & Sell based on the System Signals".
Don't sell when there is no sell signal as we all want to follow the good trends til the end like everything in life does. \(^-^)/
Also, my system is extremely diversified through over 100 markets so that it only risks less than -1% of the total capital per trade.
Thank you and good luck!
---
DISCLAIMER:
I am NOT a financial advisor, and nothing I say is meant to be a recommendation to buy or sell any financial instrument.
My views are general in nature and I am not giving financial advice. You should not take my opinion as financial advice. This is my opinion only.
Do your own due diligence, and take 100% responsibility for your financial decisions.
Trading and investing are risky! Don't invest money you can't afford to lose, because many traders and investors lose money. There are no guarantees or certainties in trading.
- Content is for education purposes only, not investment advice.
- Trading involves a high degree of risk.
- We’re not investment or trading advisers.
- Nothing we say is a recommendation to buy or sell anything.
- There are no guarantees or certainties in trading.
- Many traders lose money. Don’t trade with money you can’t afford to lose.


Is CISCO exhausted from selling pressure?LONG - CSCO
SL: 46.60 (Suggested by our algorithmic systems)
SL: 45.24 (Safer option, personal suggestion)
TP: 49.60
Reasons behind this idea:
1. Resistance trendline is subjectly broken.
2. Clear bullish divergence on MACD indicator.
3. Bullish divergence on Stochastic indicator.
Caution: Earnings Report is due in a few days.
---------- Chart Drawings ----------
Red Dotted Line: Broken Resistance Trendline
Purple Line: Suggested Stoploss by our algorithmic systems (under testing)
Pink Line: Personal Stoploss Recommendation
Green Line: Suggested Take Profit
Green Arrow: Bullish Divergence
Please trade responsibly and good luck!

