DOCU future bounce playHey all, I'm currently watching DOCU for a potential double bottom into a gap-fill; I'm waiting to see where the stock is towards the end of the week, but I am likely going to buy some should it pull back in anticipation of a larger bounce.
DS3 trade ideas

DOCU money losing negative eps dead cat bounceBear market rally dead cat bounce on DOCU. Stock is down 80% from ATH and experiencing a dead cat bounce. Housing market on precipice of collapse, interest rates over 6.25% on 30 year loan DOCU business will be impacted

DOCU dead cat bounceLikely nothing more than a dead cat bounce. CEO stepped down abruptly, negative EPS, higher employee turnover, economy and housing coming to a grinding halt, is DOCU business model bleak? The chart has lots of overhead resistance on Fibonacci, Williams alligator, 20 day moving average, 50 day moving average, 200 day moving average, the cloud resistance it's been trading under for months in a downward trend. Bear markets contain many violent rallies to the upside which are generally opportunities for bagholders to sell before the next leg lower. Friday many stocks surged into the close where DOCU lost 25% of it's daily gain and high volume after touching FIB .382. Guess we'll see next week.......

Earnings watch 3/9Earnings watch 3/9: I was so busy yesterday I never got to publicly post earnings.
DOCU
SFIX
RENT
ENZ
FCEL
VNCE
MTN
NIO
SIG
BILI
Do your own due diligence, your risk is 100% your responsibility. This is for educational and entertainment purposes only. You win some or you learn some. Consider being charitable with some of your profit to help humankind. Good luck and happy trading friends...
*3x lucky 7s of trading*
7pt Trading compass:
Price action, entry/exit
Volume average/direction
Trend, patterns, momentum
Newsworthy current events
Revenue
Earnings
Balance sheet
7 Common mistakes:
+5% portfolio trades, capital risk management
Beware of analyst's motives
Emotions & Opinions
FOMO : bad timing, the market is ruthless, be shrewd
Lack of planning & discipline
Forgetting restraint
Obdurate repetitive errors, no adaptation
7 Important tools:
Trading View app!, Brokerage UI
Accurate indicators & settings
Wide screen monitor/s
Trading log (pencil & graph paper)
Big, organized desk
Reading books, playing chess
Sorted watch-list
Checkout my indicators:
Fibonacci VIP - volume
Fibonacci MA7 - price
pi RSI - trend momentum
TTC - trend channel
AlertiT - notification
tickerTracker - MFI Oscillator
www.tradingview.com

$DOCU - beaten down, needs to rise? Ideal entry 84.11 on a pull back
Target is 91.80
If it pulls back to 78.30 ish, then I will go in heavy on reversal confirmation with the same target

Docusign USA Sun Storm Investment Trading Desk Present's: SSITD Portfolio of the Week Series
Focus: Worldwide
Everyday
For more Company Chart and Informational Analysis Please Visit: www.tradingview.com
By Sun Storm Investment Research
A Profit & Solutions Strategy & Research
Contact: Find me anywhere debadipb
Trading | Investment | Stocks | ETF | Mutual Funds | Crypto | Bonds | Options | Dividend | Futures |
USA | Canada | UK | Germany | France | Italy | Rest of Europe | Mexico | India
Disclaimer: I am not a financial advisor, so please do your own research before trading & investing anything. This is information is for only research purposes not for actual trading & investing decision.
#debadipb #profitsolutions

DOCU SP FALLS AFTER WEAK Q4 EARNING REPORT, WHERE IS THE BOTTOM?DOCU stock lost $73 in the pre-market today after announcing a weak Q4 Earning report. Now it is at $160. Is it a good buy opportunity for the company believers or bargain hunters? Have a look at the chart, I think it should fall to the long term support trend line (in dark blue color) in a couple of days before starting a new uptrend for its sustainable growth. If this long term trend line cannot hold, it mean a long-term bearish trend will start.
I don't have any position with DOCU but will consider to buy a small amount of shares when it tests the long term trend line.
My idea can be 100% wrong, do your DDs before entering any trades.
DocuSign, Inc. provides cloud based software in the United States and internationally. The company provides e-signature solution that enables businesses to digitally prepare, sign, act on, and manage agreements. It also offers CLM, which automates workflows across the entire agreement process; Insights that use artificial intelligence (AI) to search and analyze agreements by legal concepts and clauses; Gen for Salesforce, which allows sales representatives to automatically generate agreements with a few clicks from within Salesforce; Negotiate for Salesforce that supports for approvals, document comparisons, and version control; Analyzer, which helps customers understand what they're signing before they sign it; and CLM+ that provide AI-driven contract lifecycle management. The company provides Guided Forms, which enable complex forms to be filled via an interactive and step-by-step process; Click that supports no-signature-required agreements for standard terms and consents; Identify, a signer-identification option for checking government-issued IDs; Standards-Based Signatures, which support signatures that involve digital certificates; Payments that enables customers to collect signatures and payment; and eNotary, which offers the ability to execute electronic notarial acts. It offers industry-specific cloud offerings, including Rooms for Real Estate that provides a way for brokers and agents to manage the entire real estate transaction digitally; Rooms for Mortgage, which offers digital workspace to create and close mortgages; FedRAMP, an authorized version of DocuSign eSignature for U.S. federal government agencies; and life sciences modules that support compliance with the electronic signature practices. The company sells its products through direct, partner-assisted, and Web-based sales. It serves enterprise, commercial, and small businesses. The company was incorporated in 2003 and is headquartered in San Francisco, California.

DOCUSigns of decaylooks like itll keep going here, into the $60s imo. Support left untested probably has to fill out.
DOCU price predictionAfter DOCU bounced from the strong support of $73, as predicted:
now it could get even worst. the company is still a growth stock with negative earnings and a Market Cap of $18.443Bil.
i think it`s reasonable to believe it can touch the $65 support if it doesn`t deliver a great quarter.
Looking forward to read your opinion about it.

Docusignit's a long game, has not bottomed out, the comapny is not profitable and assets are negative on the balance sheet
but the tech is revolutionary if it materialises in 2024
wait and observe consolidation before acting come 2023

$DOCU with a Bearish outlook following its earnings #Stocks The PEAD projected a Bearish outlook for $DOCU after a Negative Under reaction following its earnings release placing the stock in drift D with an expected accuracy of 50%.
Docusign pullbackGot rejected at resistance short to fib level 93$.. if it bounce cover, if it falls through stay short till support

docu and S&P 03-17-22Docu
1 S&P is coming into a strong resistance level,
2. its bouncing off of previous support,
3. its in a down trend,
4. it has very strong support down at 57 dollars.
entry 81.44 traget 59 and stop 91

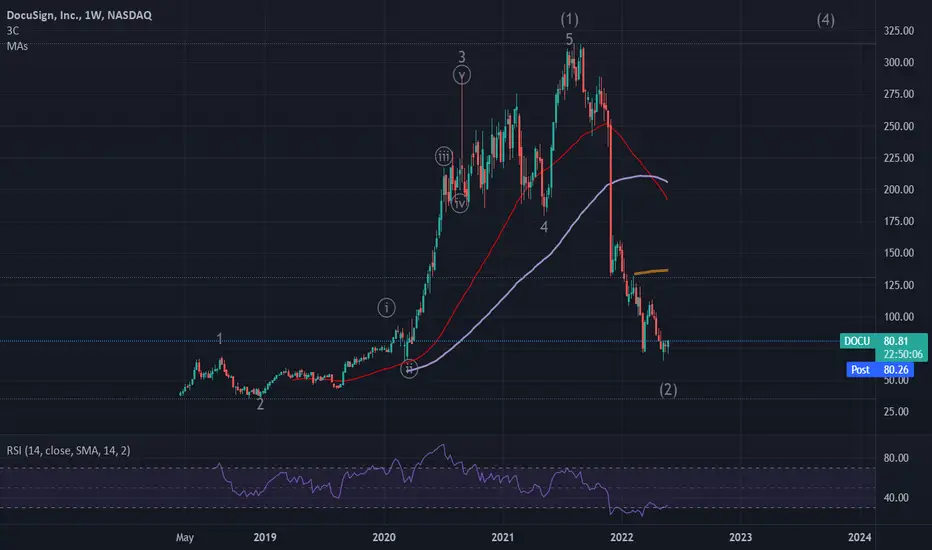
DocuSign ScenariosElliott wave is done, however, if push comes to shove, targets are labeled. Watch closely for the play! Impulse down is truly possible considering market conditions.

Docu Sign USA Sun Storm Investment Trading Desk & NexGen Wealth Management Service Present's: SSITD & NexGen Portfolio of the Week Series
Focus: Worldwide
By Sun Storm Investment Research & NexGen Wealth Management Service
A Profit & Solutions Strategy & Research
Trading | Investment | Stocks | ETF | Mutual Funds | Crypto | Bonds | Options | Dividend | Futures |
USA | Canada | UK | Germany | France | Italy | Rest of Europe | Mexico | India
Disclaimer: Sun Storm Investment and NexGen are not registered financial advisors, so please do your own research before trading & investing anything. This is information is for only research purposes not for actual trading & investing decision.
#debadipb #profitsolutions

DOCU at February 2020 support DOCU DocuSign is now at the 52 Week low, ranging 90.91 - 314.76, which coincides with the February 2020 level.
Considering the chart, i expect a bounce from here to the $111 resistance.
Looking forward to read your opinion about it.

DOCU heading for ~$140.DOCU , strong company.
Expecting to hit bounce back from here to range of ~$120.
Play safe.
Regards,
Subhash

Relief rallyEnough damage done to this one. For now i think it will get into its Wave B up for a target close to $200.

DOCU Possible Closing the gap Trade?DOCU took a beating in December with a massive gap down from 227$ to $131... HUGE..... The recent low of $108 is now showing Bullish Divergence with the TDI, Will it have the legs to close the gap? back to $227..... lets see eh :)

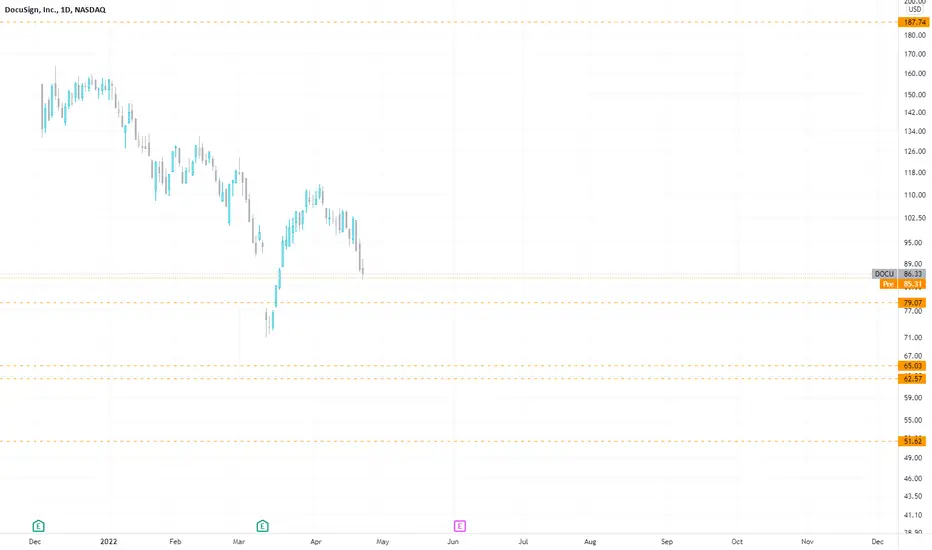
DOCU bottom in? $122.39 the KEY support or risk drop to 89.49Plotted is a single set of Fib Extensions based on the "Impulse".
Golden fibs are the 1.618x multiples acting as "major" landmarks.
Darker Blue fibs are "semi-major" ratios and lighter blue "minor".
$ 122.39 is the current major support just passed.
$ 109.83 is a tired support that will not hold again.
$ 89.49 is the next stop if current golden fib is lost.
.
I do not use "Fibs" in the "traditional" manner (retracements).
I use Fibs to plot "Ripples" (extensions) created by "Impulses".
Then look for "Confluences" to map the "interference Pattern".
My TV collection of ideas detailing the Concepts:
Chapter 1: Introduction and numerous Examples
Chapter 2: Detailed views and Wave Analysis
Chapter 3: The Dreaded 9.618: Murderer of Moves
Chapter 4: Impulse Redux: Return to Birth place
Chapter 5: Golden Growth: Parabolic Expansions
Chapter 6: Give me a ping Vasili: 'one' Ping only
Chapter 7: The Mighty 2.618: like a Rook in Chess
.

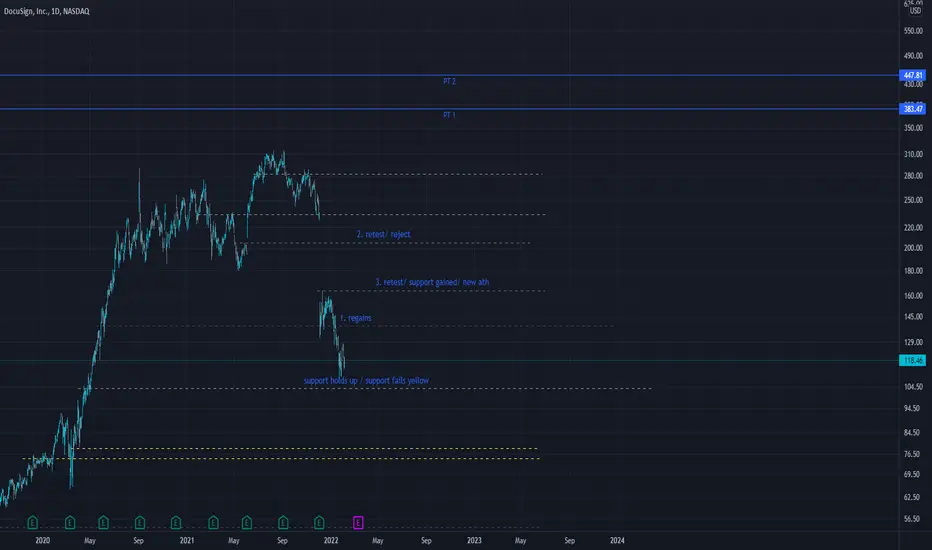
Docusign areas of interesta bunch of interest here. it makes sense that it continues to fall given the current outlook. yellow is realistic. IF we do hold this support then the rest is written out. looking for a regain and retest of high support. healthy to get rejected there come back to generate momentum to push towards ath. three price targets marked.
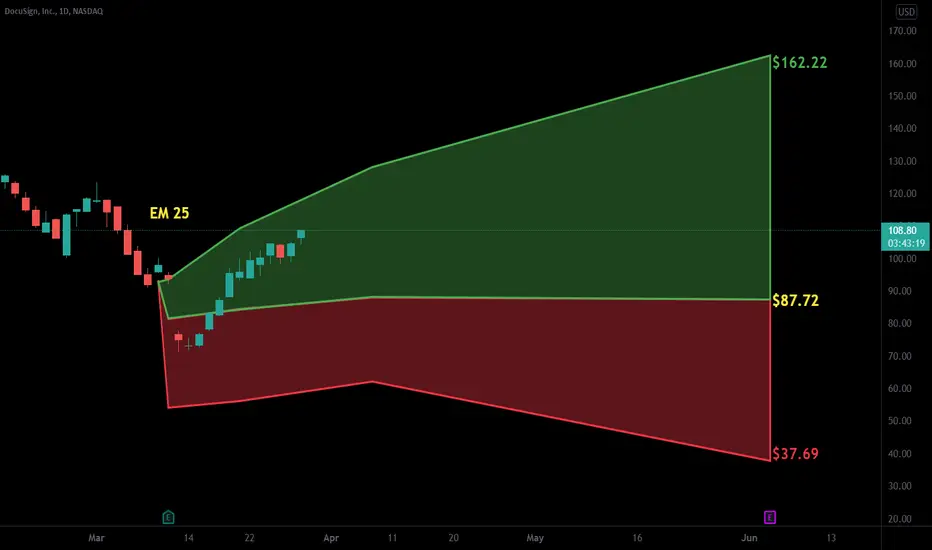
Parabolic ArcMost arcs fall between the.618 and .786 fib levels. Price is between these 2 levels now. Price can fall more or less than these fib levels. Price can also fall below the bottom on occasion.
These are difficult to trade at the top due to extreme bullishness. The bullishness has chilled out and that is the time to maybe take a look at the security.
An ARC can be volatile for quite a while after falling back to earth.
This is a monthly chart and steep rises are often easier to see in weekly and monthly time frames.
Short interest is 4.45%/Earnings are 3-3 AMC.
No recommendation/Remembering buyers become sellers/just try not to get stuck up there when the tides change )o:
