Why is Target doing so bad?Why is Target doing so bad?
Company Analysis
Why is Target doing so bad? They've really fell off a cliff over the past year. I look at their stores and they seem good, and once upon a time not too long ago they were outperforming Walmart. Now their NAV prices have really dropped over the past year and a half. I was once up 80% on these guys and know I'm down 20%. Is it the general market swing over the course of that time or something else? What gives?
Discussions over the price is not my concern but the people arguing why is it?
this idea is for analysis only.
This is not a financial advice.
DYH trade ideas

TGT near cluster support area!I would not rush into puts unless cluster support breaks here, watching for break of 171.17 for long play / break of 134.52 for shorts

Bullish TEST : TGTAfter a quick price action, now is the time to move higher to confirm this strenght on the 15m.
We need a move above the level which would mean bullish crossover

TARGET is over punishedIt's true that economy is deteriorating, so does the Target (TGT) stock. However, the retailer giant TGT stock has been unreasonably undervalued. The current price is no longer reflecting the strength of growing revenue and profit for the company. Market has been overly pessimistic about the future economy and unrealistically dumping the stock. The valuation shows that the company is financially growing after the pandemic fall. But the stock value remained in decline. It is very cheap now to own TGT stock at discounted price.

TGT extremely oversold. can start load shares#TGT extremely oversold on Weekly chart.
#TGT also create double bottom on 1h chart at 105.79$
IF can hold 105.79$, #TGT can back test up to 115-116$
IF can't hold 105.79 next support will be 102.89$
I'm loading shares at 106$

May be close to a bottom, pending dead cat bounce?It could be rough next couple of weeks. Market can rally from middle of October until early January. This can continue to crash next year as showed with my arrows.
This is just a prediction and not an advice.


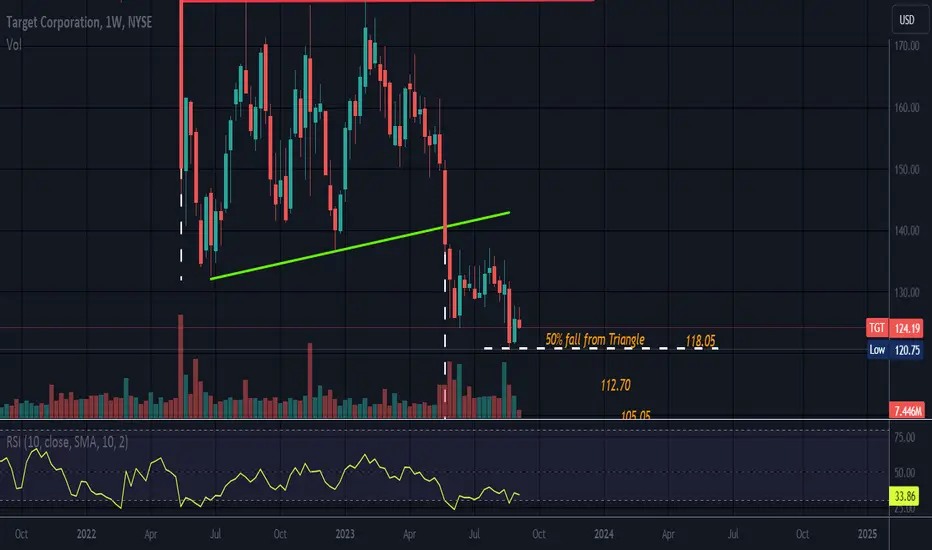
Weekly Chart//TriangleLooks like an Ascending Triangle o the weekly timeframe.
All triangles are neutral until broken. This Ascending Triangle has broken to the downside.
Targets in orange and were calculated using the wide end and fib levels.
Price has hit the 50% mark. The next target is the .618, then the .786 then 100%.
Price can fall less or more than 100%. T1 which was the .382 has been passed.
No recommendation.
If one does not see a pattern on daily, sometimes there is one on weekly.
The green line should be red as prior support is now resistance.
Keeps fallingMultiple bearish patterns. Last week just confirmed a bearish flag and broke an important support at 125. Price may try to test back the broken support now resistance at 125, but I really don't think is going any higher, too much bearish pressure. You can open a small position tomorrow and if it tests back add more. It has a lot of room to go lower. It may also trade sideways for a few days but eventually will fall. Hold it and wait.

Target - Why Is Everyone Desperate To Long Disasters?Target is another example of the so-called "contrarian" trade that circulates on financial social media where, somehow, everyone puts on their VERY SMART PERSON baseball caps and gets long because it MUST BE TIME FOR THE MOTHER OF ALL SHORT SQUEEEEEEEEEEEZES.
And yet time and time again it never works.
Paypal is a really fine example.
Paypal - Going Long In a Bear Market?
I mean cool, if you bought at $59 in May (you didn't) and sold at $77 on the last two days of July (you didn't) then you made $18 a share and are a VERY SMART PERSON.
And then it gave it all back in a day on earnings and people are killing themselves buying the dips again.
Same with T-Mobile, Verizon, and Disney
Disney - Is Your Compass Upside Down?
It's at long time lows. Went up a bit on earnings. And then gave it all back over the span of a few days and people are still "buying teh dip," primarily because some Signal or Discord or picture of a girl on Musk's new Xeeeeeeeter app said "muchwow prize target nao $120 be a winner like me and BUY CALLS."
These are things that you need to stop doing. When something trades like a bag of doorknobs for a long period of time it's because it really is a piece of crap that will eventually go lower, and so instead of buying that dip, sell that rip.
Better yet, ignore this kind of junk and trade what is actually trending, the indexes, or just go outside for a month or two and come back when the chop is over and save your trouble.
Look at the monthly bars on Target. "Zoom out," they always say.
I understand this because in the first two months I wanted to go long on this thing for at least a retrace to $150 too.
But instead the old "support" has become new "resistance."
And this tells you that new lows are most likely coming.
And when Target flirts again with $100 people will go even more bigly long.
The longs trapped from $125 and $130 will double their position.
But this piece of crap probably won't bounce.
Have you actually been on their website and looked at the clothes they sell? Look at stuff like women's intimates (lol). Do you know they have an isle in the stores devoted to fleshlights?
Do you know that they allow people to steal?
That, my friends, is real "fundamental analysis". What's the bull case? That someone told you the EllLioT WaVeS SaId $160 MiniMum?
This is a chain that was bounced out of Canada because it was Zellers 2.0.
These markets, all the equities, all the commodities, the entire world is in for a rough future. The rough future might only last for a few months, but it might last for a few years.
If you don't "paradigm shift" ahead of schedule, by the time you do get your paradigm shifted forcefully, it will be too late for crying.
And so my only wish with these things is to wake you up. China is the world's central stage and what's going on with Xi Jinping, the Chinese Communist Party, and its 24-year persecution against Falun Dafa is the fundamental story that everything else is a slave to.
Time to wake up, my friends.

TGT Target Corporation Options Ahead of EarningsLook at how perfectly this TGT price action was followed:
Now analyzing the options chain and the chart patterns of TGT Target Corporation prior to the earnings report this week,
I would consider purchasing the 136usd strike price Calls with
an expiration date of 2023-8-18,
for a premium of approximately $2.66.
If these options prove to be profitable prior to the earnings release, I would sell at least half of them.
Looking forward to read your opinion about it.

Target long2020 supply turn demand
Higher low
Dollar weakness
Breakout incoming
Gap fulfillments required

TGT stock has both stepped back on 2.618 in golden sectionTGT stock has both stepped back on 2.618 in golden section
This figure shows the weekly candle chart of Target Corporation's stocks over the past two years. The top to bottom golden section is superimposed in the figure. As shown in the figure, Target Corporation's stock peaked three times in August and November of last year, reaching its highest point in January of this year, reaching the 1.618 position of the golden section in the figure! Moreover, the two low points of Target Corporation's stock this year have both stepped back on the 2.618 position in the golden section of the chart, and are about to reverse and move upwards!

Target to break back to the upside?Target - 30d expiry - We look to Buy a break of 138.53 (stop at 131.53)
This stock has seen good sales growth.
138.28 has been pivotal.
A break of the recent high at 138.28 should result in a further move higher.
Bullish divergence is expected to support prices.
The bias is to break to the upside.
Our profit targets will be 156.53 and 159.53
Resistance: 133.00 / 135.50 / 138.28
Support: 128.55 / 125.08 / 120.00
Please be advised that the information presented on TradingView is provided to Vantage (‘Vantage Global Limited’, ‘we’) by a third-party provider (‘Everest Fortune Group’). Please be reminded that you are solely responsible for the trading decisions on your account. There is a very high degree of risk involved in trading. Any information and/or content is intended entirely for research, educational and informational purposes only and does not constitute investment or consultation advice or investment strategy. The information is not tailored to the investment needs of any specific person and therefore does not involve a consideration of any of the investment objectives, financial situation or needs of any viewer that may receive it. Kindly also note that past performance is not a reliable indicator of future results. Actual results may differ materially from those anticipated in forward-looking or past performance statements. We assume no liability as to the accuracy or completeness of any of the information and/or content provided herein and the Company cannot be held responsible for any omission, mistake nor for any loss or damage including without limitation to any loss of profit which may arise from reliance on any information supplied by Everest Fortune Group

TGT Short PositionHi traders,
let´s take a look at TGT analysis.
Wait for the price to retest the resistance zone and enter the short position.
Our estimated target is 132.14$.
Entry and stop loss are indicated on the chart.
Good luck

Will it hit my $TGT?With NYSE:TGT struggling to find its footing after its May downturn, it's due for good news. The upcoming earnings report might be the catalyst needed to challenge the persistent downward trend. Despite lagging behind NASDAQ:AMZN and NYSE:WMT , TGT is working hard to regain ground it suffered from overstocking issues and inefficient offloading strategies like promotions and sales, logistics updates, and donations. Anticipate news about these strategies, and potential dividend increases to attract new investors.
Bullish Case - TGT, currently range-bound, is trying to incorporate pandemic-related impacts into its pricing. It's at least a $150 stock and should be valued accordingly. The downtrend is a reaction from major investors who want resolution to existing issues and a plan for longevity. They've had plenty of time to address these issues.
Bearish Case - It's a range-bound distribution phase. Note how it's retracted over 50% of its gains from the pandemic low. Typically, continuation is 38%, but it's even surpassed the .618 golden ratio. It would be wise to avoid complications and let sleeping dogs lie. Claiming it would return to pandemic levels is too aggressive, but a price just above $100 should attract stronger supporters for a rebound.
Conclusion - TGT isn't a fan favorite, and understandably so. However, the aggressive pullback is noteworthy, even WMT didn't face this level of pressure. The chart below shows a substantial divergence, presenting an opportunity. At this point, the ball is in TGT's court. How they act in the latter half of the year will determine their fate.
Bullish - 140.27
Bearish - 125.25

TGT appears to be breaking out of the short term channelTGT appears to be breaking out of the short term channel after bouncing off of support at 130

TGT 12hr Chart Watching TGT leading up to earnings. This looks bottomed and expecting good earnings based on the inflationary trade.
Interested to see the price action as earnings approaches with the number of gaps on the chart.

TGT 6R short ideaTGT is showing big sign of weakness and try to go back to 100s . let me know what you think

Another leg down for TGTIt looks like Target is breaking down once again, after consolidating for months. I was originally looking to go long but I opened a small put position for September.

TGT looks ready for a pump Looks like it's in accumulation after price dropping because of woke boycotting

Major Support Broke on Target. TGTABC downward zigzag. Gentle ABCD triangle for B Wave here. Confluence of Fibonacci goals shows us some good targets. Bolinger Bands are squeezing. My guess is we are in Wave 4 of a SubWave 3 of an undetermined degree.
We are not in the business of getting every prediction right, no one ever does and that is not the aim of the game. The Fibonacci targets are highlighted in green with invalidation in red. Confirmation level, where relevant, is a pink dotted, finite line. Fibonacci goals, it is prudent to suggest, are nothing more than mere fractally evident and therefore statistically likely levels that the market will go to. Having said that, the market will always do what it wants and always has a mind of its own. Therefore, none of this is financial advice, so do your own research and rely only on your own analysis. Trading is a true one man sport. Good luck out there and stay safe.

Target ready for more downside (Daily)Target is approaching another downturn as we have just finished off the micro wave 4 correction inside the wave 5 down. If we take a look at the top of the macro wave 4 (which is in yellow) we can see I have drawn out the micro wave count of the macro Wave 5 we are in.
The Fibonacci levels fit in with the Wave 2 and Wave 4 corrections inside this downturn. With this being said I see more downside coming for this stock and is a good time to probably get some PUT OPTIONS flowing because we have seen rejection at the .236 rejection pretty heavily
