channel breakout and strong support I had already created a setup for First Solar on 29.11.2021. This was stopped out with a loss of approx. 7%.
Now a new buying opportunity arises through chart analysis.
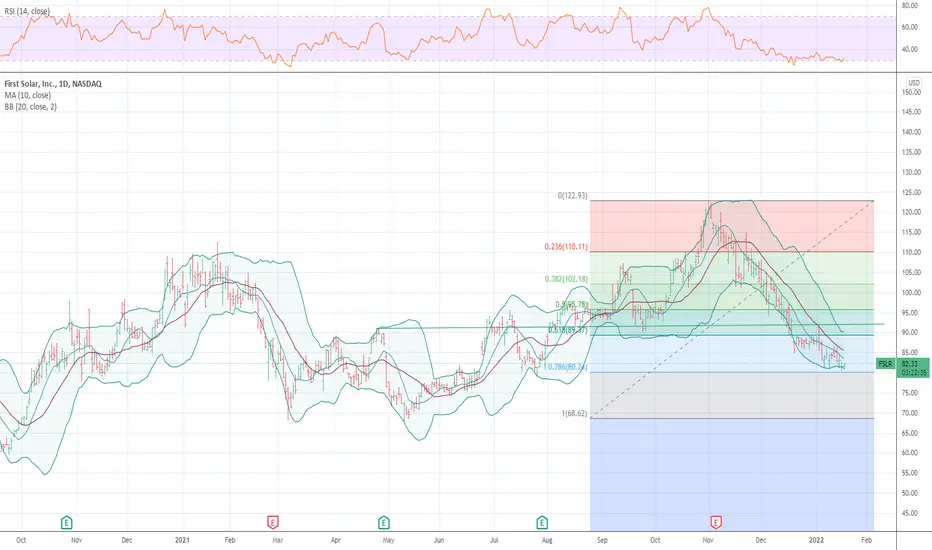
On February 14, the price formed an Inverted hammer (not perfect), which often appears at the end of a downtrend.
Yesterday's price formed a Hammercandle which could indicate rising prices.
First Solar is just about to leave a downtrend channel. Breakouts from such long channels (over 100 days) or ranges can result in very strong price movements.
The share has formed strong support at $68.
Therefore, there is much to be said for a rise in the price, and good risk management is also given, as the stop loss (SL) can be set below the support zone at approx.63 $.
However, I usually only set the stop loss in my mind. For me, the closing price in daily is decisive. If this closing price is below this zone, I close the trading position manually. It often happens, that the price triggers the SL intraday, only to rise again afterward. This is avoided in this way.
The price has potential up to $91 (take profit 1) or even up to $109 (take profit 2). This corresponds to a ratio of 2 (TP 1) and 3.9 (TP 2). The loss would only amount to approx. 13%. The profit, however, would be 27% or 50%. Therefore, I see a good buying opportunity.
What do you think?
I am very grateful for feedback :)
Deutsch
Am 29.11.2021 hatte ich bereits ein Setup für First Solar erstellt. Dieser wurde ausgestoppt mit ca. 7 % Verlust.
Nun ergibt sich eine neue Kaufgelegenheit durch Chartanalyse.
Am 14. Februar bildete der Kurs einen Inverted Hammer (nicht perfekt), der oft am Ende eines Abwärtstrends auftaucht.
Der gestrige Kurs bildete eine Hammercandle, welcher steigende Kurse anzeigen könnte.
First Solar ist gerade dabei einen Abwärtstrendkanal zu verlassen. Ausbrüche aus solchen langen Kanälen (über 100 Tage) oder Ranges können sehr starke Kursbewegungen zur Folge haben.
Die Aktie hat bei 68 $ einen starken Support gebildet.
Daher spricht viel für einen Anstieg des Kurses und ein gutes Risikomanagement ist ebenfalls gegeben, da der Stopp Loss (SL) unter die Supportzone bei ca. 63 $ gesetzt werden kann. Den Stop Loss setze ich jedoch meistens nur im Gedächtnis. Für mich ist der Schlusskurs im Daily ausschlaggebend. Ist dieser Schlusskurs unter dieser Zone, schließe ich den Trade manuell. Es kommt oft vor, dass der Kurs innerhalb des Tages den SL triggert, um danach wieder zu steigen. Dies wird so vermieden.
Der Kurs hat Potenzial bis 91 $ (Gewinnmitnahme 1), bzw. sogar bis 109 $ (Gewinnmitnahme 2).
Dies entspricht einer Ratio von 2 (TP 1) bzw. 3.9 (TP 2). Der Verlust würde nur ca. 13 % betragen. Der Gewinn jedoch bei 27 % bzw. 50 %. Daher ergibt sich für mich eine gute Kaufgelegenheit.
Was denkst du?
Für Feedback bin ich sehr dankbar :)
F3A trade ideas

FSLR SHORT TERM BUY 10% RALLY The chart posted in the solar sector is making a low today and should rally a 10 % move to the upside rather fast this would be a low risk long
First Solar AnalysisLooking at FSLR this is what I see:
- it broke out of the strong resistance @76-81 which is now a support area (weekly chart)
- if this support area breaks, this will lead the stock to another downtrend
- currently at an uptrend (daily chart)
- at 06' Jan: bullish pin bar at the trend line -> reversal of the short downtrend?
- next resistance level: ~@91.75
this is just an analysis from me. feel free for open discussion

Breakout from a bullish consolidationFirst Solar
Entry: 107.3 $
TP 1: 139.1 $
TP 2: 150.6 $
SL: 99.25 $
Currently a strong sector

Maybe Long?The paper corrected to its previous low. Upside: +20%. In case of a breakdown of the support level, a 10% drop There will be room to average out if not to exit on the stop.
❤️ If you find this helpful and want more FREE forecasts in TradingView
. . . . . Please show your support back,
. . . . . . . . Hit the 👍 LIKE button,
. . . . . . . . . . . Drop some feedback below in the comment!
❤️ Your Support is very much 🙏 appreciated!❤️
💎 Want us to help you become a better Stock trader?
Now, It's your turn!
Be sure to leave a comment let us know how do you see this opportunity and forecast.

FSLR Head and shouldersClean Head and shoulders on FSLR. Good risk to return Ratio. let me know if any questions

10/31/21 FSLRFirst Solar, Inc. ( NASDAQ:FSLR )
Sector: Electronic Technology (Electronic Components)
Current Price: $119.59
Breakout price trigger: $118.00 (hold above)
Buy Zone (Top/Bottom Range): $117.40-$111.50
Price Target: $113.00-$135.50 (1st), $175.40-$178.00 (2nd)
Estimated Duration to Target: 21-23d (1st), 78-84d (2nd)
Contract of Interest: $FSLR 11/19/21 120c, $FSLR 1/21/22 150c
Trade price as of publish date: $5.70/contract, $2.07/contract

FSLR looks ready for a push to all time highsFSLR has the best relative strength out of the big solar names such as SPWR, JKS, CSIQ, RUN, ENPH, & the solar ETF TAN. While these other names were in a downtrend, FSLR held up quite nicely and has a ton of time at price in the range 92-96. It appears it was set to breakout mid September but the recent market correction caused a temporary pullback to its accumulation down.
This structure is similar to ROKU's back in September 2020 when it tested all time highs after building a long base in the 150 range. Once it broke it out, the market had a correction which caused ROKU to go back down to it's base before breaking out for real when the market let off the pressure.

FSLR...........................................................................................................

Confirmed breakout for solarTrade on patterns and trends
That's the only strategy.
Keep holding. Target between $138-157.


Technicals say go long (maybe)Nice infrastructure play with an inverse head and shoulders forming. The tax on competitors products, who produce their products in Vietnam/ Thailand area to get around the Chinese tariff, would be ideal as FSLR is all homegrown. Expansion to India along with the catalyst of the infrastructure bill should see this bad boy move north if the market doesn't decide to flips its head on this current bounce. Filling the gap aside, nice inverse head and shoulders, technicals curling and FV estimate of 113.61~. Have a position and here is to hoping its game time!

FSLR SUPPORTGreat golden cross on sight. Trend line support as well,
We can see this bad boy making a move.
Don’t forget to like and subscribe for research on swing trades ideas. Thank you for the support

FSLR LongLove this stock for a long term hold . Don't see how this could be a bad hold.
Pull backs that gave 40 - 50% back.. Bot up.
Huge 200-300% possible move from current prices still.


$FSLR 6 Month Cup w/ HandleCame across $FSLR doing my weekend chart flipping.
Love how this big 6 months cup w/ handle base is building up.
* Nice large base ☑️
* Price tighting up on the right hand side ☑️
* Vol drying up ☑️
* Vol pattern confirming price (OBV at Hs or NHs) ☑️

FIRST SOLAR, INCshort term opportunity ( seems impossible to take this down 30% from the current price but who knows ? only risk 4% from the current price to take the maximum target ),
have been trading inside the huge down trending market which push it to the downside , have rejected at the major resist and also a rejection to the top of bearish flag , we will see how price react to the market for an entry zone .
we will never know how the market works.

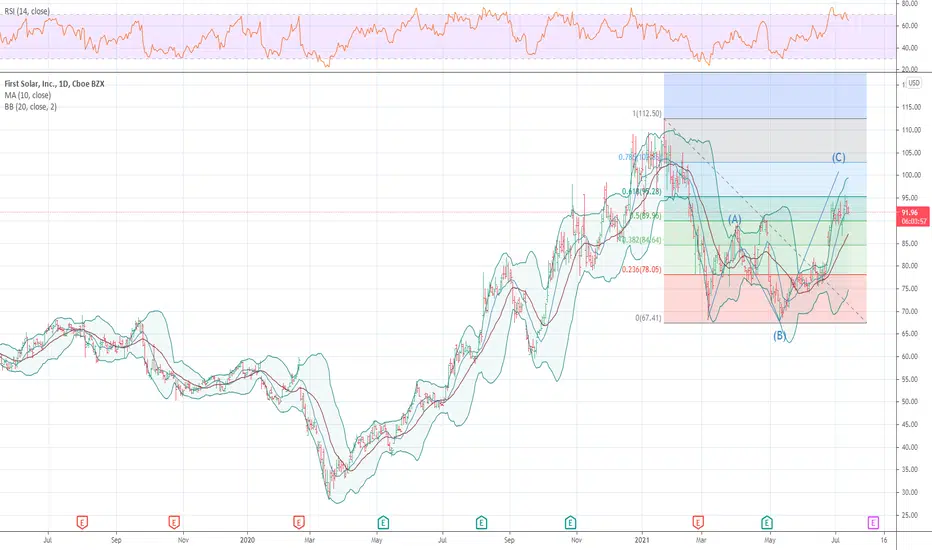
ABC BullishPossible stop below C.
ABC is a corrective, or a pull back pattern. A retest of C occurs frequently and if price goes too far below C, then often best to stay out. C often occurs between the .786 and .618 of the AB leg. Targets are calculated using the AB leg and fib levels. The target is D.
Looks like earnings were received well.
No recommendation


RetracementFirst Solar has reached the Fibonacci Retracement of the rise since June 26th already. A first long position seems possible here. One shall mind the gap down and the gap down beneath and watch out which one will be closed first.

FSLR call$100 Call exp 8-6. Price target $102. Looking good for a MACD cross above the 200 MA and parabolic sar showing

Gap UpOn Thursday we have opened with an upward gap that could no be closed until now. This points on a further strength of the stock.
