FSM trade ideas


Higher lows, and proper exposure to silver spot price!Potential gain:30%
Reward/Risk:3.3
Timeframe: 1-6wks
I always try to present the charts in a simple comprehensive format to prevent any confusion.
This is just my technical view, neither a fundamental comment,nor a recommendation to trade..!
Please review my track record and calculate the odds for yourself..!
You’re likes and comments encourage me to continue this.
Stay tuned great live stream and quality content videos coming soon..!


Primed and Ready to Run Alongside SilverExpecting to open strong and breakout of resistance at market open Jan 4.
Will be monitoring prior resistance as pull back on phase 1 of run up.

Gap up $FSM All metals and crypto are up miners will be following.
Gap up through resistance
NYSE:FSM

Puts/Shorts - Bearish Crab on FSMAfter breaking out of a bullish rectangle, FSM has broken out and run up (made some profits on that move). However, it is now entering the Potential Reversal Zone of a bearish crab. Conservative target is B and aggressive would be C. If I was doing shorts I would risk 5%, but probably would get out if it had momentum above the marked historical resistance. Up to you for your own risk management. Not financial advice. Also looking a little overbought.


Silver lining in FVIThis is a request from a follower.
From the chart, we can see that the price action has broke out of the weekly bearish trend line. This is crucial to see the big picture.
Next, the price action is travelling in a upward channel but has now meet with some resistance (at 9.05)
Please compare this chart with the one you are trading with as it can be different. There is a gap at 7.69 to 8.28 awaiting to be filled. Is this also happening in the chart that you are using to live trade as well ? Do not assume they are both the same.
Once you are done here, zoom down to the details on the candles pattern over the last few days. What do you see ? You can see clearly that it has broken out of the channel initially but not strong enough to push to the next higher level. Bears come in to push the price down as witnessed on 5 Aug 20 red candles.
Of importance, the last closing candles tell me the bears have won, temporarily. This is a pin bar which is bearish in nature. Therefore, we can say , the probability of it heading south towards the lower channel is high.
It could fall to the lower channel and rebound OR falls through the channel and
Depending on your strategy, it is not encouraged to short as this stock is on a strong bullish move on multiple time frames. Shorting now is a countertrend strategy and require precise entry and exit and risk/reward does not seems justifiable.
So, if you are buying or accumulating, you want to wait for the price to fall and revisit resistance turn support at 6.95 level or the minimum at 8.00 where the gap is closed and monitor a bullish signal before entering.
Another possible alternative would be the price action starts to hover around 8.34 to 9.81 for a while (ie. breaking out of the channel) before deciding its next move (likely upwards).
One last point to note - if you are already longing silver , then you want to ensure your portfolio is not overly geared towards silver or gold related stocks/ ETFs, etc. A concentrated portfolio is like putting all eggs in one basket. There is nothing wrong with this strategy if you are fully aware what you are doing and have a clear strategy.
The challenge is striking a balance of not overly concentrated or overly diversified.
I hope this analysis is useful for you. All the best in your trading! GBU.

Target 4.90I decided to position myself on this company because it allows me to position on silver and at the same time invest in a solid company.
I believe that silver has more growth potential than gold and is more attractive for the current price. I will use this company to invest in silver and at the same time to protect myself from inflation.

Fortuna Silver Mines - Long Term PitchforchRSI & stochastics are positive.
This is a great long-term play to get leverage from rising silver prices.

Elliot wave analysisI'm into crypto, but looking at silver mines. This company is interesting so I did a quick Elliot Wave analysis. It looks like impulse wave 1 is finished and wave 2 is a retest of either the support or the channel top. I duplicated the fractal of the last bull run and stretched it to, so that Impulse wave 1 would match. This is the manner I used to determining the target. Fibonacci would be 1.414 to 1.707 to top of future wave 5. The fractal really lines up well with the resistance/support levels.


LONG FSMExpecting bounce from extremely oversold weekly and daily levels. If stop breached, be prepared to catch new daily reversal on lower levels with a tight stop.

Very bullish chart for Fortuna Silver Mines (FSM)Despite silver miners getting hammered lately, FSM looks like a good buy at these levels.
Both the MACD and KST indicators show a bullish crossover happening right now. This comes at a time when the stock has bounced off its one-year support level of $2.40. A close above this level should mean further upside potential in the near-term.

Strengthening my positionAs the silver markets are continually depressed, yet keep showing impulsive character, I believe Fortuna Silver Mines is a great value right now. Keep in mind that we need to hold the ~3.30's for this to stay valid, so that would be a great place to have stops.

Bullish Reversal PatternThe fundamentals look good for Fortuna, and I'm bullish on silver long term anyways. I think I'll be using this stock to invest in silver and profit from rising prices. If this reverse head and shoulders plays out, we could see 60-75% profit. I am not long yet however as I am waiting for a convincing break above the neckline, and a retest of the top of it.

FSM LongFSM
Entry 3.87
Stop 3.65 (-5.68%)
Profit Target 1 4.23 (9.27%)
Profit Target 2 4.37 (12.77%)

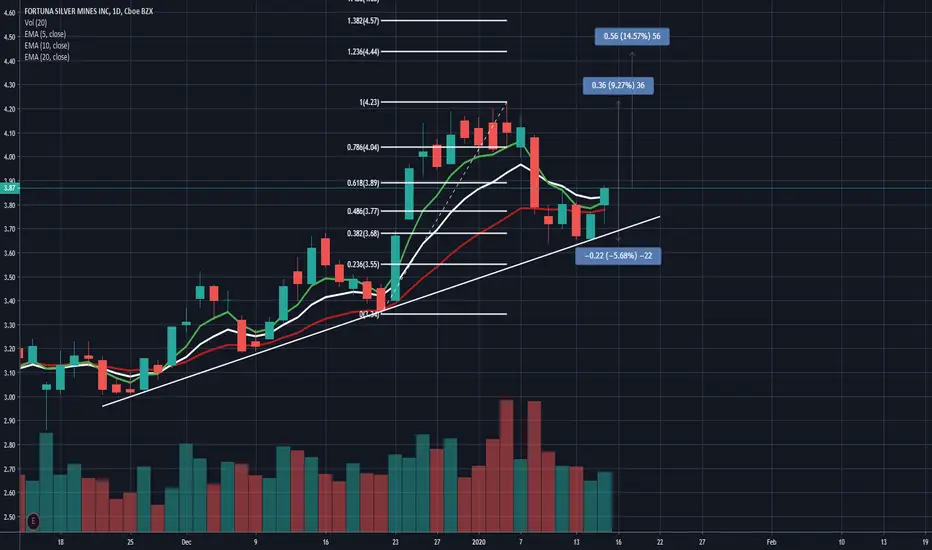
FSM Long• FSM
• Entry: 3.87
• Stop loss: 3.65 (-5.68%)
• Profit target 1: 4.23 (9.27%)
• Profit target 2: 4.44 (14.57%)

[Long] FSMEarlier I posted a breakout in Silver, here is a silver miner.
A little inverse H&S showing up on today's action. It seems a little fast for a holiday week. I expect some consolidation that might give a chance to add.
This one moves really fast when it wants to (gray rectangle).
