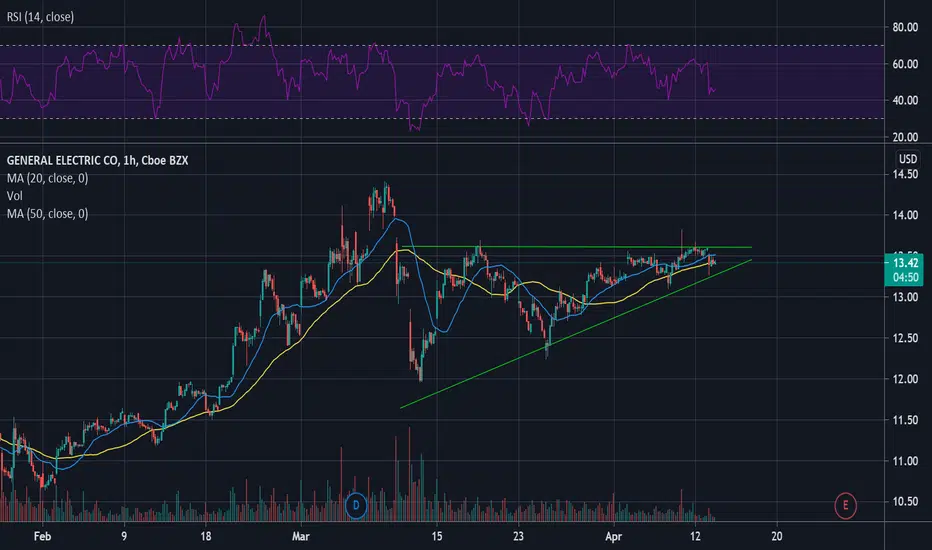
GE - Long IdeaShowing some reaction off Demand Zone,
If we catch some momentum, we can break out of this descending pennant and move higher
GEC trade ideas

$GE with a Bearish outlook following its earnings #Stocks The PEAD projected a Bearish outlook for $GE after a Negative Under reaction following its earnings release placing the stock in drift D
If you would like to see the Drift for another stock please message us. Also click on the Like Button if this was useful and follow us or join us.

GE Bullish 2 Wedges Inside a WedgeGE General Electric looks bullish with this continuation pattern. We can see a 2 falling wedges within a falling wedge. Check out my Youtube Page for more details on the markets I covered GE recently in a video. The fundamentals look pretty solid as well this one should do well short and long term.

GE long middle termFundamentally very bad company but technically looks like bullish for middle term

GE Which Way?An argument could be made here for a bullish pennant. Historically ~$13 has been a strong area of resistance looking back at Oct 2018 and Feb 2020. GE has been trading in bullish trend for a while now. As of recent it seems to consolidating with some indecision. If it breaks through the $14 barrier, could continue a nice bull run, however if it breaks to downside, I think we could see a retracement back to the ~$11.80 level and further consolidation.
This is my first idea, any feedback is welcome.


Be careful with GE!Hi community! GE has a weak divergence on RSI, and it it loses the 13.07, the first target will be the 12.77, and the second target at 12.21.
Be careful, dear traders!
If you liked this trading idea, remember to click on the “Follow” button to get more trading ideas like this, and if you agree with me, click on the “Agree” button 😉.
See you soon,
Melissa.

GE 🌦Potential running Flat Elliott Correction Wave ABC. I would like a retest of $14 before I long puts. if we do retest $12 I'll wait for an LDC (Lower degree correction, its in blue) before engaging with calls. In my opinion GE is still undergoing its Elliot correction wave (since 03/21)

Lights going out?!Exhaustion on the monthly, March and April shows the bulls just dnt have it in them. We also have a thick cloud right above so the path of least resistance down.The weekly also just broke below its tenkan which adds to the confluence. The target zone is the monthly kijun zone aorund 10.
Entry: 12.89
TP: 10.03
SL: 14.06
R: 2.44
Risk Management critical!


GE 🌦➡️Pattern recognized:
POTENTIAL Running flat
➡️Hypothesis:
Bearish
➡️Catalyst:
Earnings in one 1 day.
➡️Conclusion:
call credit spreads iron condors and put credit spreads might be off interest for this type of catalyst.
***This does not constitute financial advice.***
If you like what you see why not support us?
👇

GE Could go either way... (LONG TERM)GE has entered a consolidation zone. a breakout from this zone will indicate whether GE will have huge gains or will drop significantly.
This projection is long term, GE could oscillate in this zone for years, or it could happen very soon. Keep GE on your watchlist and occassionally check back.
My prediction is LONG with an increase of 8x over 8 years. (70% likely) .
This long prediction is because of the nice double bottom that happened in MAY of 2020. Since GE rose back up as fast as it dropped indicating that it will continue in an uptrend.
This is a super long term prediction that will take a lot of time for it to reach this goal, however I feel that now is a good time to buy shares worth $14 that could be worth $100+ by 2029. As far as projected inflation is concerned, this will still be a gain of +20% over 5-year inflation.
There is a possibility that we have hit an upper level of the current downtrend. This may be the case, however, With the current business/economic plan of the U.S. GE is a company that has influence inside the American government and personally I think will win in the end.

Good risk/reward long on GEI like the risk/reward on this currently, watching for triangle break. Would think having stop just under major resistance turning support, might be valid for a entry now, 50/50 risk profile IMO.

GE: Complete Multi Time Frame Analysis (1h, D, W).Hello traders and investors! Let’s see how GE is doing today and do a complete Multi Time Frame Analysis (MTFA) on it!
First, in the 1h chart, we see a short-term bear trend , as we have lower highs/lows, and a purple trendline connecting the previous tops. But GE recently hit the orange line at $ 12.79, which is a nice support level.
If GE is about to reverse this short-term trend, now is the best time for it. The stock must either break the purple trendline or make a bullish structure. Now, let’s see the daily chart:
We may have a short-term bear trend in the 1h chart, but the trend is slightly bullish in the daily chart. Although we don’t have higher highs, we do have higher lows, and GE just hit the purple trendline today, which is a nice support level as well, and it is bouncing back up.
The orange line in the 1h chart and the purple trendline in the daily chart make this price level a Dual-Support zone in different time frames, something worth noticing.
Today’s reaction is quite good, but GE still must defeat the green line at $ 13.69 in order to fly again, as this point worked as a resistance twice in the past, and it seems to be an important psychological point. While this is possible, keep in mind that we are in a delicate situation in the long-term perspective:
We recently hit the green line at $ 13.26 (pre-covid high), and now the stock is dancing around this price level. It can’t drop, because it is still a strong stock, but it is not that strong to the point of breaking this resistance for good.
All that is left is an annoying congestion , until the 21 ema catches up with the price. We have something that resembles a Pennant pattern , and if that’s the case, fantastic.
The low volume is another evidence that this is just a harmless correction in larger time frames, but although this is a good sign, it'll probably take a while before GE does something interesting again.
We must be patient here, but let’s keep monitoring GE closely. And if you managed to read this far, remember to follow me to keep in touch with my daily studies, and please, support this idea if you liked it!
Thank you very much!

GE Bullish Pennant I believe this stock is going higher -- both technically and fundamentally. The stock price is consolidating in a bullish pennant formation. The company will benefit from the government's infrastructure spending bill.

GENERAL ELECTRICGE has broken a very strong resistance barrier,I expect the companies share to rally strongly.

Potential Breakout PlaysHere are some breakout plays I'm looking at this week. $GE and $F have held up well and I will be watching closely for entries on both of them this week. Like and Follow :) Good Luck!


GE breakout incoming?ascending tringle on 1 hour.
possible swing set up.
first pt of 14.50 (the retest of ATH).
not financial advice.
GE 1 Year Analysis (Price Action)Beginning in late September and early October of 2020, we started to see a recovery of GE from a huge decline due to covid in march having the stock price decrease from about 12.5 to 6.5.
After staying relatively neutral for about 6 months, it finally showed signs of an uptrend around fall. It first surpassed the 100SMA in late September and intersected the 10SMA and 200SMA in early November to confirm an upward trend in price action.
The channel I have displayed is the time it initially introduced its electric car concept to compete with the US's powerhouse, Tesla, and China's head manufacturer, Nio.
It has been remained above support levels since November and has seen a percentage change in 80%, nearly doubling from 7.5 to 13.5.
Due to my analysis on this 1year price action, I am long on GE and I'm very bullish in the long term as I suspect it will see considerable yet safe growth in the next 6 months-1year.
