GE | General Electric | Potential Inverse Head & ShouldersGE | General Electric | Potential Inverse Head & Shoulders
General Electric is showing the potential for an "Inverse Head & Shoulder Pattern"
The price should bounce above $81 in order to confirm
this pattern.
Targets:
🎯 95.61
🎯 102.58
🎯 114.73
Thank you and Good Luck!
PS: I know that the economy may face a recession soon so let's say out of this topic😂
I am discussing only the technical perspective and what I see on the charts:)
GEC trade ideas

Short scalp GEBased on its downtrend, regress off resistance and a familiar chart pattern confirmed by my technical indicators, I expect at least half a percent in profits IF
GE breaches Friday's low of $73.68 during Monday's session.

GEStarting to get a second daily close outside of support line on RSI along with possibly getting a daily close outside of price line. Weekly and daily RSI seem to be rolling over together. Getting rejected off of 200MA. MACD on daily getting close to crossing, and weekly MACD is under 0 line as well. Caution would be if the weekly RSI closes over 50 line.

$GE with a Bullish outlook following its earnings #Stocks The PEAD projected a Bullish outlook for $GE after a Positive Under reaction following its earnings release placing the stock in drift A.

GE ShortNYSE:GE
After putting in a pretty clear topping pattern, GE price action is working it's way through a descending triangle.
With rates rising, I am expecting price to fall out of the triangle and run down the pitchfork to the 0.5 to 0.618 Fib level.
Price target = $70 - $77 range.

General Electric Breaks SupportGE breaks down for a short idea, see chart for entry / stop / target.

GE - Fib Circle Providing Hope A Head and Shoulders pattern can be drawn within the blue ring of fib circle, if you allow a recovery of the current price action
As always the trend is your friend, which can be seen to be bearish, but an upward move is still possible.

Positive sparks offer further selling opportunity in GEGeneral Electric Company
Short Term - We look to Sell at 82.00 (stop at 87.00)
Previous support level of 85.50 broken. The overnight dip has been bought into and there is scope for further bullish pressure going into this morning. We look for a temporary move higher. The reaction higher is positive, however, we view this as an opportunity to set shorts in line with the overall bearish move lower. Further downside is expected although we prefer to set shorts at our bespoke resistance levels at 82.00, resulting in improved risk/reward.
Our profit targets will be 72.00 and 65.00
Resistance: 82.00 / 85.50 / 94.00
Support: 72.00 / 65.00 / 60.00
Disclaimer – Saxo Bank Group. Please be reminded – you alone are responsible for your trading – both gains and losses. There is a very high degree of risk involved in trading. The technical analysis , like any and all indicators, strategies, columns, articles and other features accessible on/though this site (including those from Signal Centre) are for informational purposes only and should not be construed as investment advice by you. Such technical analysis are believed to be obtained from sources believed to be reliable, but not warrant their respective completeness or accuracy, or warrant any results from the use of the information. Your use of the technical analysis , as would also your use of any and all mentioned indicators, strategies, columns, articles and all other features, is entirely at your own risk and it is your sole responsibility to evaluate the accuracy, completeness and usefulness (including suitability) of the information. You should assess the risk of any trade with your financial adviser and make your own independent decision(s) regarding any tradable products which may be the subject matter of the technical analysis or any of the said indicators, strategies, columns, articles and all other features.
Please also be reminded that if despite the above, any of the said technical analysis (or any of the said indicators, strategies, columns, articles and other features accessible on/through this site) is found to be advisory or a recommendation; and not merely informational in nature, the same is in any event provided with the intention of being for general circulation and availability only. As such it is not intended to and does not form part of any offer or recommendation directed at you specifically, or have any regard to the investment objectives, financial situation or needs of yourself or any other specific person. Before committing to a trade or investment therefore, please seek advice from a financial or other professional adviser regarding the suitability of the product for you and (where available) read the relevant product offer/description documents, including the risk disclosures. If you do not wish to seek such financial advice, please still exercise your mind and consider carefully whether the product is suitable for you because you alone remain responsible for your trading – both gains and losses.

$GE with a Bearish outlook following its earnings #Stocks The PEAD projected a Bearish outlook for $GE after a Negative Under reaction following its earnings release placing the stock in drift D with an expected accuracy of 66.67%.

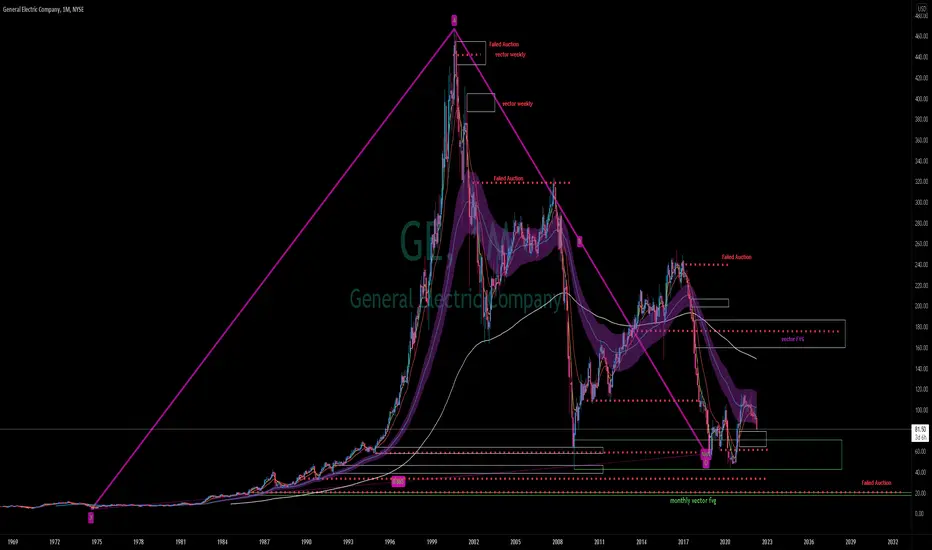
GE all time 88.6? I was trying to think about some of the oldest companies I knew of to chart some thoughts. Playing around with the ideas of all time 88.6 retraces, mean reversion, fair value gaps, failed auctions, vector recovery over time. General Electric looks like a prime example of my ideas.
Just charting for the fun of it <3
NYSE:GE
$SPY $JKS $COST $GE watchlist for week 4/25 - 4/29 $SPY $JKS $COST $GE watchlist for week 4/25 - 4/29 :
$SPY Calls > 427 | Puts < 425
$JKS Calls > 58 | Puts < 50
$COST Calls > 585 | Puts < 562.5
$GE Calls > 93 | Puts < 88
Levels posted, stop losses set to your entry

Short term bulls on General Electric. GEGoals 98, 102. Invalidation at 88.
We are not in the business of getting every prediction right, no one ever does and that is not the aim of the game. The Fibonacci targets are highlighted in green with invalidation in red. Fibonacci goals, it is prudent to suggest, are nothing more than mere fractally evident and therefore statistically likely levels that the market will go to. Having said that, the market will always do what it wants and always has a mind of its own. Therefore, none of this is financial advice, so do your own research and rely only on your own analysis. Trading is a true one man sport. Good luck out there and stay safe

GE InvestmentI just watched a documentary last night called 'Blue Gold: World Water Wars.'
I must say, very revealing 90 minutes of multiple perspectives on the growing water crisis. The one key point I took from it is that GE is the leader in desalination.
Without the hypocrisy of badmouthing civilization's consumption habits and general ways of life, because I play my role like everyone else, I will say that I feel wholeheartedly, based on what I saw in that documentary alone, that most of the first world is ignorant of how scarce clean water actually is in the world, and the problems it creates.
I'm going to invest in water for my new born son's portfolio, I think in that time horizon it's a sure thing, the Bushes were buying water rights up in the last financial crisis, so I'm a little late, but not too late. ;)
Being that GE is the leader in desalination as of recent years, and that they're not directly correlated with the broad stock market and the general water utilities at euphoric highs, I think I'll start here, red arrow indicates potential first breakout of most recent price action on this timeframe, a new higher high and higher low? only time will tell..
Technically speaking, I'm only posting the quarterly chart, because this is the primary trend of that asset and I'm looking 50 years out, very long term. This looks to have found big support and is in the process of breaking out of its 20 year down trend, which from this long term of a perspective, it could be argued a correction within the confines of an up trend.
Namaste fellow humans, Peace.

5/4/2022 NYSE (GE)Short (Entry Price) below the black line and exit (Stop Loss) above the red line. Can take profit at the suggested Target Price.
Entry Price: $91.85
Target Price: $91.06
Stop Loss: $92.64

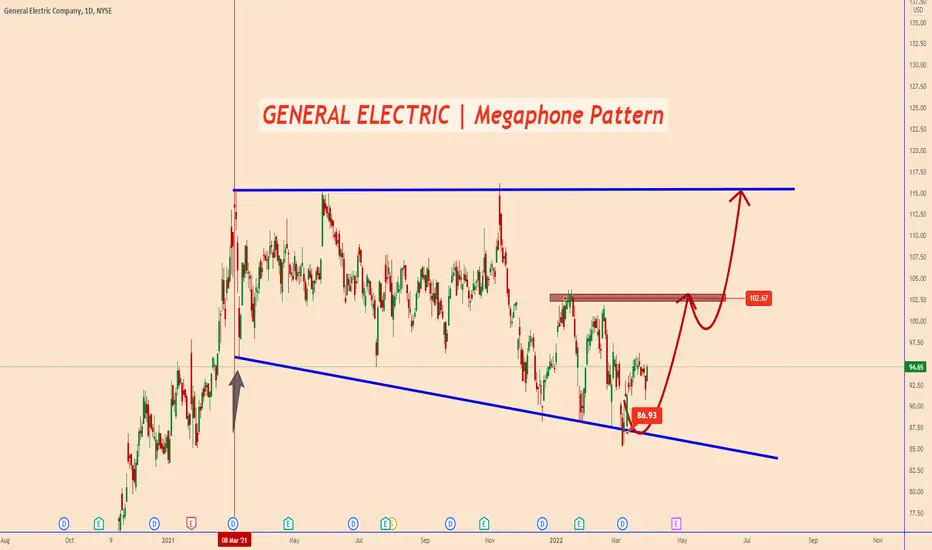
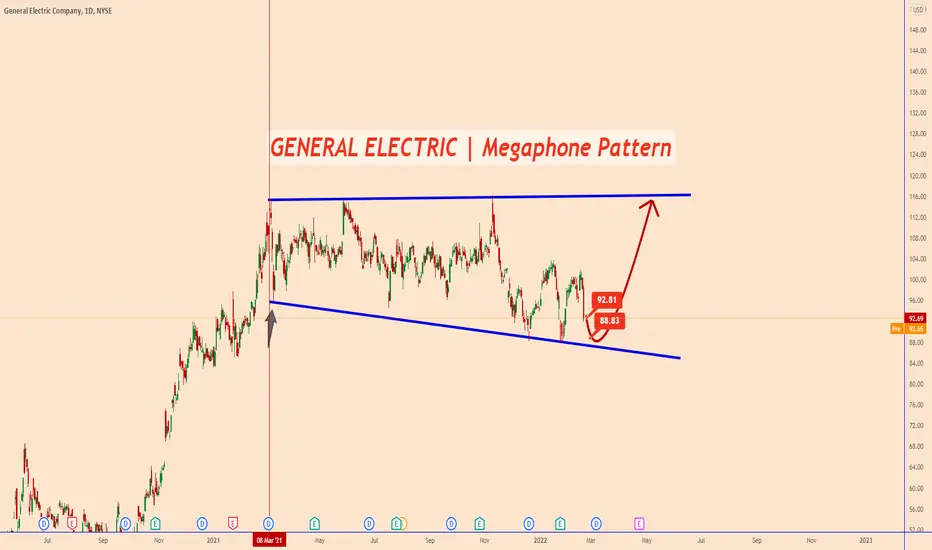
GENERAL ELECTRIC | Price is Moving Within a Megaphone Pattern📣GENERAL ELECTRIC | Price is Moving Within a Megaphone Pattern📣📣📣
As we can see from the chart the price is moving inside
a megaphone pattern.
Actually, the price looks like it is actually resuming the expected bullish movement again.
The price is moving in this daily corrective model since March 21st
So the price spent almost one year in order to create this pattern.
A potential bullish movement is expected from the support area
between 92.8 and 88.8
Thank you and Good Luck!
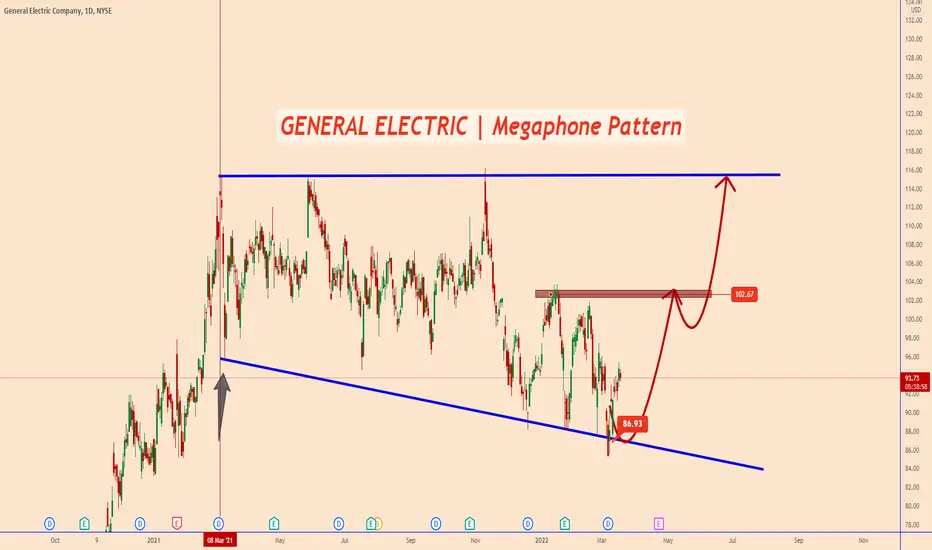
GENERAL ELECTRIC | Price is Moving Within a Megaphone PatternGENERAL ELECTRIC | Price is Moving Within a Megaphone Pattern
As we can see from the chart the price is moving inside
a megaphone pattern.
Actually, the price looks like it is actually resuming the expected bullish movement again.
The price is moving in this daily corrective model since March 21st
So the price spent almost one year in order to create this pattern.
A potential bullish movement is expected from the support area
between 92.8 and 88.8
Thank you and Good Luck!
Did General Electric Just Break Support?General Electric staggered throughout the course of 2021, and now the bulls may be jumping ship.
The main pattern on today’s chart is the close under $88. The industrial stock bounced around that level in December, January and February. Has it finally lost relevance as support?
Next, consider the lower high last month versus January. That kind of descending triangle is potentially consistent with a downtrend starting.
Third, GE hit a 2-1/2 year high above $115 on November 9 after management formally announced its three-part breakup plan. It then failed to hold that peak, which suggests investors “sold the news.”
Fourth, shortly after the stock broke lower, its 50-day simple moving average (SMA) slid beneath the 200-day SMA: a potentially bearish “death cross.”
TradeStation is a pioneer in the trading industry, providing access to stocks, options, futures and cryptocurrencies. See our Overview for more.
Important Information
TradingView is not affiliated with TradeStation Securities Inc. or its affiliates. TradeStation Securities, Inc., TradeStation Crypto, Inc., and TradeStation Technologies, Inc. are each wholly owned subsidiaries of TradeStation Group, Inc., all operating, and providing products and services, under the TradeStation brand and trademark. When applying for, or purchasing, accounts, subscriptions, products and services, it is important that you know which company you will be dealing with. Please click here for further important information explaining what this means.
This content is for informational and educational purposes only. This is not a recommendation regarding any investment or investment strategy. Any opinions expressed herein are those of the author and do not represent the views or opinions of TradeStation or any of its affiliates.
Investing involves risks. Past performance, whether actual or indicated by historical tests of strategies, is no guarantee of future performance or success. There is a possibility that you may sustain a loss equal to or greater than your entire investment regardless of which asset class you trade (equities, options, futures, or digital assets); therefore, you should not invest or risk money that you cannot afford to lose. Before trading any asset class, first read the relevant risk disclosure statements on the Important Documents page, found here: www.tradestation.com .

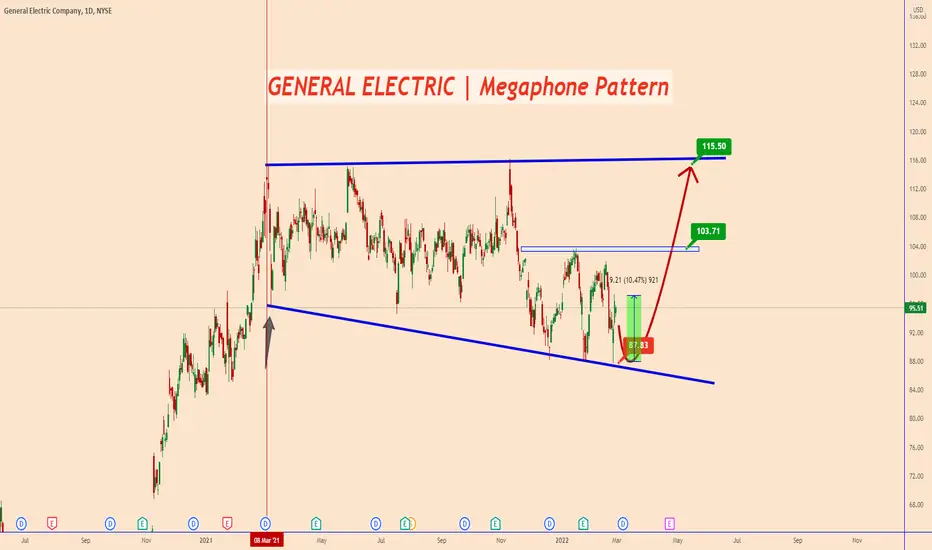
GENERAL ELECTRIC | Price is Moving Within a Megaphone PatternGENERAL ELECTRIC | Price is Moving Within a Megaphone Pattern
As we can see from the chart the price is moving inside
a megaphone pattern.
From the previous analysis, the price tested the lower part of the megaphone pattern as
expected and from there we can see a nice bounce of +10.4%
Actually, the price looks like it is actually resuming the expected bullish movement again.
The price is moving in this daily corrective model since March 21st
So the price spent almost one year in order to create this pattern.
A potential bullish movement is expected from the support area
between 92.8 and 88.8
Thank you and Good Luck!
Previous Analysis:
GENERAL ELECTRIC | Price is Moving Within a Megaphone PatternGENERAL ELECTRIC | Price is Moving Within a Megaphone Pattern
As we can see from the chart the price is moving inside
a megaphone pattern.
The price is moving in this daily corrective model since March 21st
So the price spent almost one year in order to create this pattern.
A potential bullish movement is expected from the support area
between 92.8 and 88.8
Thank you and Good Luck!

Elliott Wave View: General Electric (GE) Ended 5 Waves RallyThe short-term Elliott wave view in General Electric (GE) ended wave (1) at 88.03 low. Wave (2) rally is currently in progress as a zigzag Elliott Wave structure. Up from wave (1), wave A of the zigzag ended at 100.68 with internal subdivision as 5 waves impulse. Up from wave (1), wave ((i)) ended at 91.77 and pullback in wave ((ii)) ended at 88.05. The stock then extended higher again in wave ((iii)) towards 100.59. Wave ((iii)) subdivided again as a 5 waves of lesser degree. Up from wave ((ii)), wave (i) ended at 92.28, wave (ii) dips ended at 91.03, wave (iii) ended at 98.44, wave (iv) ended at 96.16, and wave (v) ended at 100.59.
Wave ((iv)) pullback ended at 98. Internal of wave ((iv)) subdivided as a double three. Down from wave ((iii)), wave (w) ended at 98.63, wave (x) ended at 100.47, and wave (y) ended at 98. This completed wave ((iv)). Stock then extended higher in wave ((v)) towards 100.68 which should also complete wave A. The stock is now pulling back in wave B to correct cycle from January 27 low. Internal of wave B is unfolding as a zigzag structure where wave ((a)) should end soon. The stock should bounce in wave ((b)) before it resumes lower again in wave ((c)). As far as pivot at 88.03 low stays intact, expect pullback to find support in 3, 7, or 11 swing for more upside.

Bullish on GE - Break above 97.44 will be bullish
- Volume generated over past few days is a bullish
- Take profit level is 103.71

General Electric | Fundamental Analysis | LONG SETUP If you are a millennial or older generation, you probably at least faintly remember a time when the industrial conglomerate General Electric was one of the largest and most influential companies in the world. The company was a $400 billion titan before the 2008-2009 financial crisis knocked GE down, and the company has been struggling to get back on its feet ever since.
Today, the company is in the midst of a major transformation, selling off individual divisions to reduce its business and resume growth. General Electric recently reported Q4 2021 earnings, showing that its financial performance seems to be improving. Here's what investors need to know as the company prepares for bigger changes.
Sometimes a bold move is the right move, and it's not always easy to make. In November, General Electric announced plans to spin off several divisions into their own companies, bringing General Electric's focus to aviation.
A brief description of the changes and their timing includes a GE Healthcare division in 2023. The renewable energy, energy, and digital divisions will merge and separate in 2024. General Electric will retain a 19.9 percent stake in Healthcare, but the overall deal will give shareholders three independent, industry-specific companies.
Conglomerates often trade at a discount compared to what their parts might be worth individually. A company with many different businesses has to distribute its resources, intellectual capacity, and money among its divisions. Although individually smaller, these companies can focus on their individual business models, potentially leading to higher performance and higher valuation in the marketplace.
Management's main goal has been to rebuild the company's damaged balance sheet. General Electric has paid off $87 billion in debt over the past three years and continues to make progress each quarter. In 2021, the company sold its aircraft leasing business for $31 billion (mostly) in cash, paying off the debt with the proceeds. It is also the last part of the company's financial division to be sold, eliminating what was once General Electric's most prominent business and what caused its collapse more than a decade ago.
Financial performance has yet to reach the level desired by management. As of the end of Q4 2021, the company's net debt to EBITDA ratio is 3.3, and GE wants to reach 2.0 by the end of 2022.
This ratio means that the company is aiming for $1 of annual operating income for every $2 of debt on its balance sheet (net debt means you subtract the company's cash).
The company is still working on this, but General Electric should leave any gloomy scenarios in the past because a net debt to EBITDA ratio of 3.3 is not something that should dramatically stress the business. GE even felt comfortable enough to make a $1.4 billion acquisition, buying BK Medical in 2021.
General Electric still owns additional assets that it could leverage if necessary, including stakes in Baker Hughes and AerCap totaling about $13 billion. Company executives said they intend to ensure that all three possible stand-alone companies have investment-grade balance sheets.
There are plenty of moving parts to General Electric's financial performance, including ongoing restructuring in divisions such as energy and renewables to make them more profitable, as well as the lingering influence of GE Capital. However, investors can focus on free cash flow to get a general idea of how things are going.
After generating about $600 million in adjusted (non-GAAP) free cash flow in 2020, General Electric has increased free cash flow to $5.1 billion in 2021. Management expects $5.5 billion to $6.5 billion in 2022 and more than $7 billion in 2023.
Free cash flow is vital to the business because it is real money that the company can use to strengthen its balance sheet or for acquisitions, something General Electric is actively pursuing. Many unique items can affect a company's earnings over time, so investors may want to focus on free cash flow.
The fallen giant's reputation and various financial moves seem to have discounted General Electric stock. Free cash flow of $5.1 billion against a market capitalization of $107 billion values the stock at a price-to-earnings ratio of 21.
Other industrial companies are trading at higher valuations, such as Honeywell with a P/FCF ratio of 26 and Eaton Corp with a ratio of 36. That valuation seems fair given General Electric's current position, but long-term investors may want to consider the potential value opening up as a result of the upcoming spin-offs.
It's hard to say what valuation the market will see separately for the aviation, medical and energy companies. Nevertheless, as sentiment around General Electric improves and the company's financial performance improves, investors may benefit from management's big plans.
