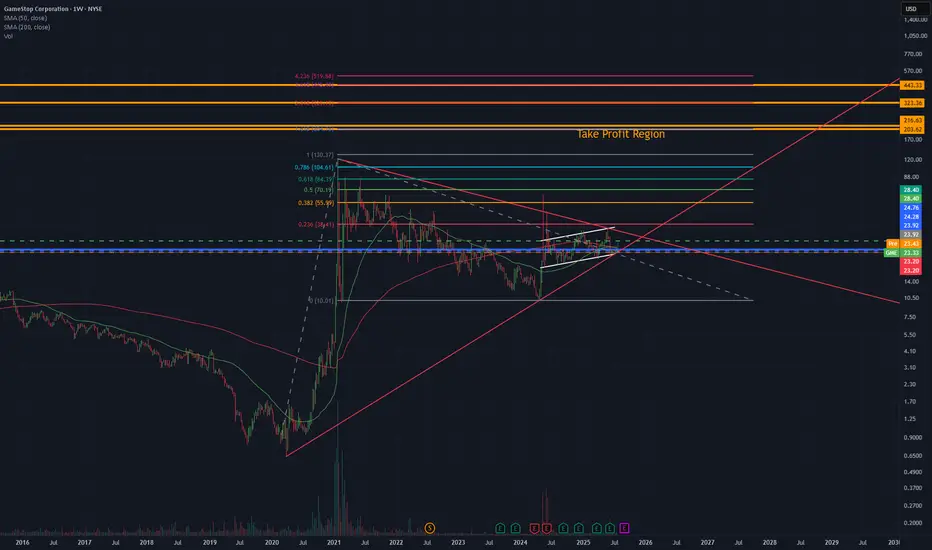
GME 1W: when the memes fade, the structure speaksGameStop is once again testing the lower boundary of its long-term consolidation, bouncing off the 21.53 zone - a level that aligns with the 0.79 Fib retracement and historical support. This zone also intersects with a key trendline on the weekly chart, and just recently, a golden cross (MA50 crossing MA200 weekly) printed - a rare but technically significant signal. The stock continues to trade inside a broad descending channel, and if this support holds, the natural next step is a move back toward the mid-range at 37.42 (0.5 Fib), followed by a possible push toward 64.92. The tactical setup favors a confirmation entry near current levels, with a stop under 21.00. Risk/reward here is among the cleanest GME has offered in months.
On the fundamental side, GameStop remains in a transitional phase. The company is shutting down unprofitable segments, reducing costs, and doubling down on e-commerce and digital distribution. Financial results are still slow to recover, but the latest Q2 2025 report showed positive operating cash flow and narrowing losses. This isn't a value play in the traditional sense - it's more about the potential for renewed retail-driven momentum if technical conditions align.
If there’s still power behind the crowd - this might be one of the most technically compelling entry zones of 2025.
GS2C trade ideas

Looking for $203Super meaningful description, chart explains itself and numbers behind in borrows and shorts are lined up, sooner than later gonna move... tgt 200-210
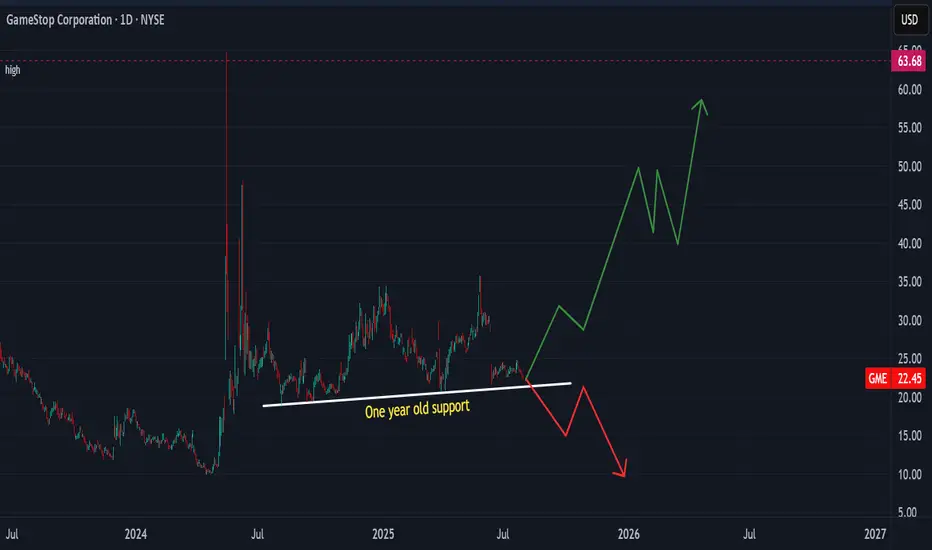
THIRD TIME IS A CHARM (SUPPORT BREAK OR FURTHER ADVANCE)Price action has been holding the one year support line from July 2024 until now. A break will see GameStop price declining further to the old support at 10.00 USD. However, price is favourably expected to rise further to test the 47.00 USD and an extension to the old high if this support holds.
Set tight stop-loss below support line.
Use reasonable margin as per account size.
Trade safe
GME Stop Bullish Watching for a pullback and entry or a break over the last resistance and re-test and an entry to fill the gap up. (Not financial advice, just posting my thoughts and plan)

Golden Cross on GME WeeklyGME Chart Breakdown, Déjà Vu or Destiny? Something big just lit up the weekly chart, the 50 MA has pierced through the 200 MA, forming that golden cross traders dream about. On the weekly timeframe. Not a drill.
Now, let’s rewind. The last time this pattern appeared? January 2021. The infamous squeeze. Back then, GME didn’t just nudge upward, it catapulted nearly 4000%, going from a $3 floor to $120 in a blink.
Fast forward to today, new golden cross, new setup, and a $23 floor. If history rhymes even remotely, we’re staring down a hypothetical $1000 per share move. Yes, one thousand.
Is lightning about to strike twice? Stay tuned to find out!

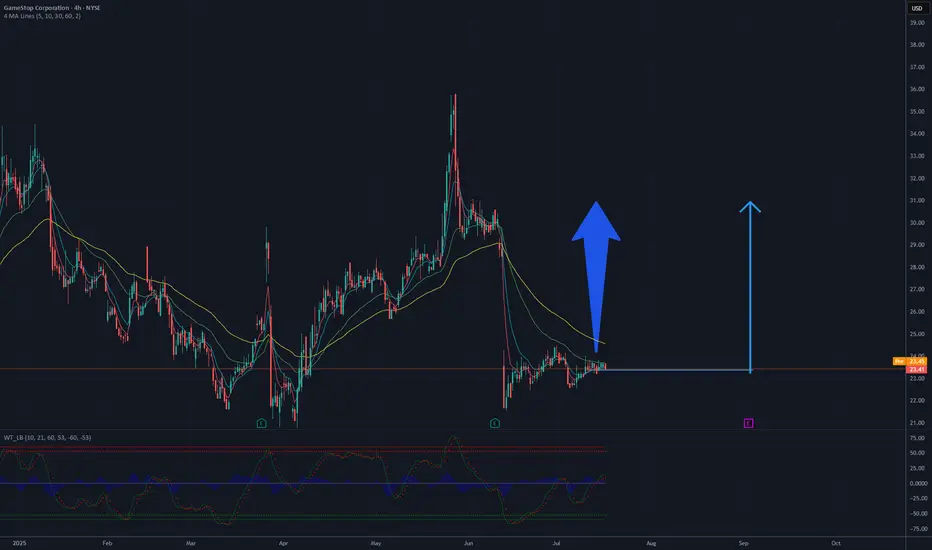
Is it a time for GAMESTOP? 30 $ in the sightAnalysis of the GameStop (GME) chart suggests a potential rise to 30 USD, based on current trends and technical levels. The 4-hour chart shows a recent decline following a sharp increase, with the price currently fluctuating around 23-24 USD. Key support is located at approximately 22 USD, which could act as a floor if the price starts to drop. The moving averages (e.g., 50-day and 200-day) indicate a previous upward trend, and current levels may represent a consolidation phase before the next upward move.
Breaking through resistance around 25-26 USD, which aligns with a previous peak, could pave the way for further growth. If demand increases and trading volume rises, the price could head toward 30 USD, a psychological and technical resistance level. Additional bullish signals, such as green candles or an increase in the oscillator (e.g., RSI) from current levels, could support this scenario. However, the risk of a sudden reversal should be monitored, especially if support at 22 USD is breached.
Potential TP: 30 USD
GME is ready to decide (weekly candles)I'm bullish because the market is bullish
Reasons for being Bullish
-above 200sma weekly and have held it as support
-200sma day crossed above 200sma weekly
-everyone knows about the stock, momentum could be something never seen before because of the notion of becoming rich in a day. Treating this as a casino.
Correlation between 2021 squeeze and 2024-2025 price actionRefer to my 2021 squeeze post idea, you can see a very similar pattern, I predict 30s mid august followed by another dip. MOASS? Probably not but maybe assuming crime has run out of tricks

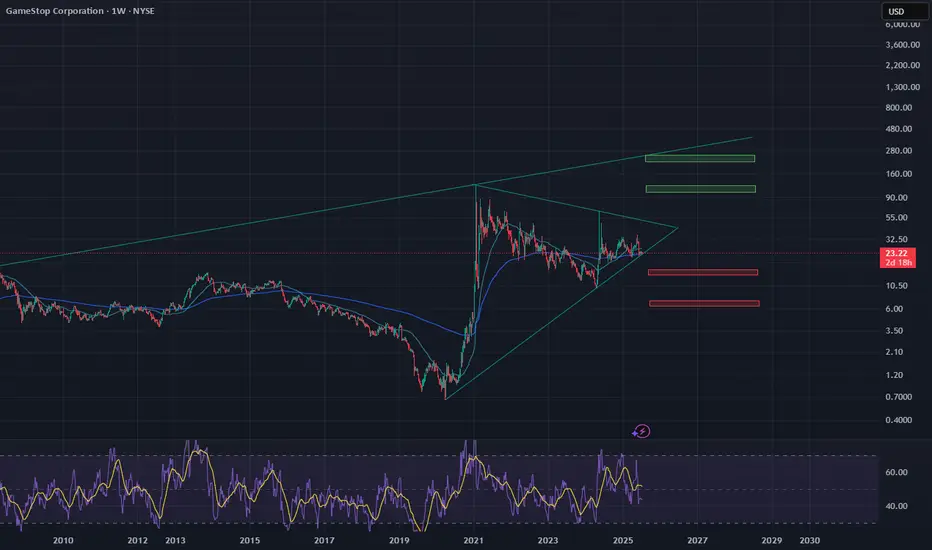
GME Potential UpsideGME looks attractive from a risk to reward perspective. I am not interested in the short squeeze speculation but the technicals and recent acquisition of BTC in their balance sheet has caught my attention as they have been sitting on capital for quite some time now.
Theres a clear gap around 28.50 and of course looming tarrifs are something to look out for. Id keep my eye on this one.

GME LONG IDEA UPDATEDIn my previous post regarding the long opportunity on GME stock, I called a long signal after a break out of a downtrend line. However, price had dropped down to the demand zone, giving another long opportunity.
To take advantage of this long opportunity, you can buy at the current market price, while the exit will be at $20.30 and the targets can be at $35.70, $47.90 and the final target at $64.70.
Confluences for the long idea are as follows:
1. Weekly break of structure
2. Valid Inducement
3. Orderflow
4. Price within the discount
5. Price respecting bullish trendline
6. Hammer candlestick confirmation
7. Price at a support level
Disclaimer: This is not a financial advice. The outcome maybe different from the projection. Don't take the signal if you're not willing to accept the risk.

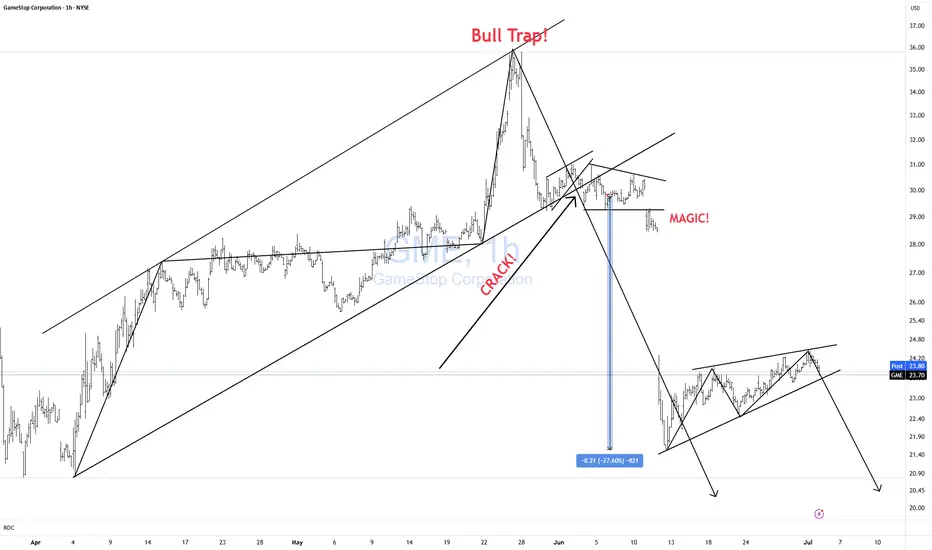
GME CRACK?Unfortunately, I keep getting forced to create new posts for the same Isea bc TV forces me to "target reached" on updates. Here is my previous post.
We have yet another bearish formation setting up in GME. Rising bearish wedge.
Wait for the CRACK!
Click Boost, like, follow, and subscribe for more!
WC: 23.59 Target: 1800-2400 MOASS: 47k-100K: PROFITI am a trader...I have one goal at the end of the day: MAKE A PROFIT
This will be my final post on Gamestop as I am now dedicating ALL of my time to Macro Market Coverage...
I FIRMLY believe that there is a high potential for markets to turn SIGNIFICANTLY LOWER over the next year and plan to show people how to trade a bear market profitably and not get absolutely wrecked
As part of my Macro Coverage I will be covering stocks that have high potential to run so I will be dropping updates on GME here and there as it runs
Ive posted every trading day (and the weekends) on Gamestop for well over a year
I was around for the original squeeze and I will be around if (no guarantees in markets as I always say) it squeezes again
Ok lets get to what you want to know:
20 Week Cycle has NOT been invalidated as far as im concerned
06/09 did see big changes but just havent seen the price improvement...yet
I think we see the price improvement start MIDDLE to END of Aug and will ramp up thru Sep/Oct
I have SPX dropping to 5100-5400 over the next couple months...that will most likely drag GME down a bit but expect 21.54 to be a solid place to position trades
If/When GME moves higher the FIBS ARE STILL YOUR GUIDE
Draw an Anchored VWAP from the 21.54 low...If GME breaks 21.54 draw another Anchored VWAP from wherever it bottoms...those two VWAPS will be the most powerful things you can put on your chart to track GME trend
TRADE WHAT YOU SEE...NOT WHAT YOU HOPE FOR
One last word on Roaring Kitty:
I do believe he is lurking and will be back...my guess as to when? Flip Mode 09/07
Histograms are not aligned yet and as you see price is choppy
From a 20 Week Cycle perspective it appears price will rise when it reaches the GREEN VERTICAL LINES
Still think this is the best interpretation ever laid out on what Roaring Kitty is doing..I obviously dont have it completely figured out though
Good Trading To You All!!!
P.S. the YEARLY VWAP is at 26....thats the likely LAUNCH point for price

ITS TIMEGME coiled on the 4hr RSI break 50 were launching from the POC area to 24.50 to next MA. Overall target after taking 26 is VAH around 27.58. The drop down was profit taking/ overextended /sell the news after all the hype leading into the btc purchase announcement they didn't disclose purchase price either from what I know. But btc is at ATH the 500M is now in decent profit and last quarter rev and earnings were good. Last time gme broke out was 17% on a overall stock market correction day, seems like thats going to be the case again for now im in the Aug 1 25 calls for .6 looking to close these in profit and roll to higher further out strike like the jan 26 35. cheers, here kitty kitty.

WC: 23.59 Target: 1800-2400 MOASS: 47k-100K: Waves of MomentumYes I still believe the 20 week cycle theory is still valid...lets get that out the way
Volatile stocks like GME are driven by two things mainly: SENTIMENT and the OPTIONS CHAIN
So what I plan to focus on from here on out is MOMENTUM
What I have been focused on behind the scenes is a better way to determine WHEN momentum is picking up so that I can strategically layer in and out with the goal of growing my position over time
I've developed a system that I will be using on GME and all stocks from this point on
Every chart for me starts with understanding the general macro Elliott Wave structure which includes drawing a main macro fib
That main macro fib gives me main longer term targets for the trade..remember each fib is a target for me but im primarily focused on the 0.618, 1.00 and 1.618 fib extensions..so focusing on the chart since the move from last year the next MAJOR FIB TARGET for me is the 0.618 at appox the 56 level
Institutional Trading houses are forward looking and develop a trading thesis for the year that they execute and manage...this process resets every year
So with that in mind I want to understand 2 things each trading year: Whats the VWAP for the year? and what level is everyone at in relation to where they were (aka whats the Volume Point of Control (VPOC))?
Why? Because those tell us where EVERYONE is in relation to VWAP...the direction price moves away from VWAP tells us what the major players intentions are..and i want to FOLLOW THE MONEY
But in order for price to move away from VWAP..MOMENTUM has to BUILD and SUSTAIN
There are many ways to measure momentum on a chart but the way that works best for me is to focus on the RATE OF CHANGE (ROC) of PRICE & VOLUME
As mentioned last week Ive developed and tuned a custom indicator to help me intimately understand ROC
Im focusing on four time frames: Yearly, 3 Month, 3 Week and 3 Day
Alignment= same timeframe color and position in relation to zero line
Alignment = Strength= look to BUY
Not in alignment= Weakness= look to SELL
NOTE: This view is what you will primarily see posted going forward as this is what im using on ALL stocks to trade in and out
Cant wait to see how this chart looks by year end :)
GOOD TRADING TO YOU ALL!!!

Cant Stop Wont Stop GameStopLast Weekly Golden Cross was January 25th, 2021.
We are now coming very close to our next Weekly Golden Cross 4 years later.
Fast MA on the Rainbow Ribbon has crossed over the Slow MA.
OBV has spiked and been building up in the same manner.
Stochastic-RSI is almost at ultra oversold & is generally a very safe indicator that the bottom is in.
IV is dangerously low & ready to break out hard.
Just like 4 years ago.
💎🤘🚀
xoxo - Bathsalt

Bearish flag forming on GamestopGME broke below this major weekly trendline that connects the lows from April of last year through the lows of April from this year and has since been forming a nice bearish flag. I anticipate it could break down below to a bigger more important weekly trendline to find support around $13. See secondary photo below

6/26/25 - $gme - Pwn the BTC treasury game6/26/25 :: VROCKSTAR :: NYSE:GME
Pwn the BTC treasury game
- everyone is focused on the wanna be Strategy try-co's
- but there is only one BTC and there is only one Strategy
- GME just issues 2 bn+ of 0% convert paper (the secret sauce to MSTR) and nobody blinks?
- You think Pomp can easily do this?
- You think Metaplanet can easily do this?
- GME is basically 90% cash and running the HARD part... raising debt. THIS IS WHAT CREATES BITCOIN YIELD, NOT EQUITY MNAV ALCHEMY. (more on this later if you guys need it)
- So here we have a situation that goes like this:
- Company is the consumer-version of Strategy... and probably the most UNDER hyped BTC treasury co. These are new buyers to the GME story
- And then as this thing runs... you think the old crew has totally lost faith? Price is the product.
- The company isn't loss making (and their collectibles biz is actually some great mgn). Have you been into a gamestop recently anon?
Let's go. Game on. Leveraged a few ITM expiries. Will size up.
Better than cash :)
V

$Entire Market - MASSIVE MOVE COMING SOONSo to keep things short, i've just seen the most massive move in my data i've ever seen in the history of my data. Moves like this indicate an extreme event in the world being priced in.
NEVER in the history of my data have i seen this kind of move in ANY stock and it's being shown in almost ALL stocks.
I think that at some point in the next 14 days we're going to have a massive 4-6 Sigma event either being rate cuts or war stuff. I don't know what it can be myself but i see the state of the world + the absolutely mind boggling move in the data and can put 1+1 together.
This combined with my AI having sold all stocks on Friday... yeah. Something is being priced in.
I had in fact thought this was like a GME thing cause i first saw it in GME's data but it's in fact a move in data for ALL stocks and happened on Friday. My dumbass bought GME on Friday thinking we were gonna see a move next week.
To keep things short the TLDR is:
-MASSIVE MOVE SOON (Next week - Maybe the week after)
-Likely direction is BIG DOWNS OR BIG UPs. Only huge outsized moves coming.
-How to play it: Straddle for safety. Puts for big risk big return.
I think we're dropping like -$100 bucks on SPY within a month based on this alone. Won't bet on it until my AI says to do so however. Right now it's just sold all stocks, hasn't bought puts yet or bought calls. Also something like -15 bucks on TQQQ and GME to $11. That or the exact opposite with some absolutely batshit insane ripper due to announcing to replace Jpow and doing rate cuts as soon as next week. It's either this or actual war, but anyway something's being priced in HARD and across the ENTIRE market. This kind of move is going to happen soon and quick, with this kind of insane liquidity, something is going to break...
Not gonna share future updates on the data for this event as to keep some secret and for myself to make money without affecting this trade by informing half the internet. Might eventually make it into a subscription thing on my website for those really interested but for now nah.
A bullish position on GME as price action indicates resilience
Targets:
- T1 = $24.75
- T2 = $25.81
Stop Levels:
- S1 = $23.00
- S2 = $22.79
**Wisdom of Professional Traders:**
This analysis synthesizes insights from thousands of professional traders and market experts, leveraging collective intelligence to identify high-probability trade setups. The wisdom of crowds principle suggests that aggregated market perspectives from experienced professionals often outperform individual forecasts, reducing cognitive biases and highlighting consensus opportunities in GameStop’s price action.
**Key Insights:**
GameStop's ongoing transition from brick-and-mortar retail to an increasingly digital and e-commerce-focused business model continues to make it an intriguing investment prospect. The company is refocusing on collectible merchandise and leveraging its loyal gamer-oriented customer base, which suggests growth potential even amidst uncertain macroeconomic conditions. Technical indicators reveal steady accumulation phase, implying confidence in its long-term appeal from institutional investors or seasoned traders.
Another important factor for GameStop comes from its niche appeal within the digital gaming realm, which could act as a counterbalance to broader economic pressure on retail stocks. As consumer trends shift towards experiential gaming content and small-scale collectibles, GameStop’s pivot could forge stronger competitive positioning.
**Recent Performance:**
Over the past month, GameStop has demonstrated relative resilience despite broader market volatility. While retail stock performance largely suffered under the weight of waning consumer confidence, GameStop remained compressed within a narrow range, indicative of investors cautiously accumulating shares ahead of potential catalysts. Recent price movements showcase a stock finding footing near key support levels amidst growing trading volume—a bullish signal.
**Expert Analysis:**
Technical analysts highlight bullish divergence seen in proprietary oscillators, supporting an upside bias. On top of this, institutional inflows remain consistent over recent weeks, reinforcing sentiment for a continuation rally. GameStop’s ongoing transformation efforts into the direct-to-consumer digital gaming experiences mitigate risks associated with economic downturns. Overall liquidity levels in equities support limited downside risk for the stock in the short term.
A close above the $23.60-$23.75 range would confirm upside momentum, with price challenges towards the $25 area by short-term swing traders. Seasonal factors within the gaming industry further support a possible upswing as Q4 approaches, a period notably associated with higher consumer spending on gaming products.
**News Impact:**
Recent headlines around global economic instability, such as geopolitical conflicts and inflation concerns, have put pressure on consumer discretionary sectors. However, no significant negative news specific to GameStop or shifts in its competitive landscape recently emerged. Updates on ongoing cost-streamlining measures from the leadership team could clarify its financial positioning even further. News in the digital gaming ecosystem, particularly around cloud-based or subscription models, may provide opportunities to reinforce positive sentiment.
**Trading Recommendation:**
For traders considering a position in GameStop, its ability to maintain price levels near $23 while navigating retail stock challenges suggests bullish potential for the near term. Current momentum indicators and volume patterns support initiating a LONG position. Target 1 at $24.75 offers an achievable upside within a week-long timeframe, while Target 2 at $25.81 provides an extended outlook should market conditions corroborate the existing upward bias. Traders are advised to set stop-loss levels at $23.00 and $22.79, managing downside risk effectively.

WC: 23.46 Target: 1800-2400 MOASS: 47k-100K: Cycles & MomentumLet me start by saying that I still do not think the 20 Week Cycle Theory has been invalidated
We are only a couple weeks in on what is again a 20 WEEK CYCLE
With that in mind based on the cycle view displayed, at this point, I have to assume this cycle will be similar to the last cycles in that the price appreciation should take place aligned with the GREEN vertical lines...which corresponds with the end of July/ beginning of Aug timeframe
The question is what does the price action look like in the meantime?
A lot of that depends on what the broader market looks like and what levels hold on GME
I do not have a crystal ball
For what its worth I have additional buys set to trigger at 21.50 and 22 with a tight stop loss in case of any moves lower
Ok now lets talk momentum
GME is obviously vary volatile and extremely beholden to the options market
I have been working for months behind the scenes on fine tuning my custom indicators to provide a stable view of increases/ decreases in momentum..and have now reached that point
On the below indicator view , generally speaking, if all 3 Histograms are GREEN and ABOVE the ZERO LINE then price is showing HIGH BULLISH MOMENTUM...and vice versa for Selling Momentum
So with that said as you see GME is still showing a lot of weakness and until we see the bullishness conditions mentioned above I expect price action to be somewhat muted
GOOD TRADING TO YOU ALL

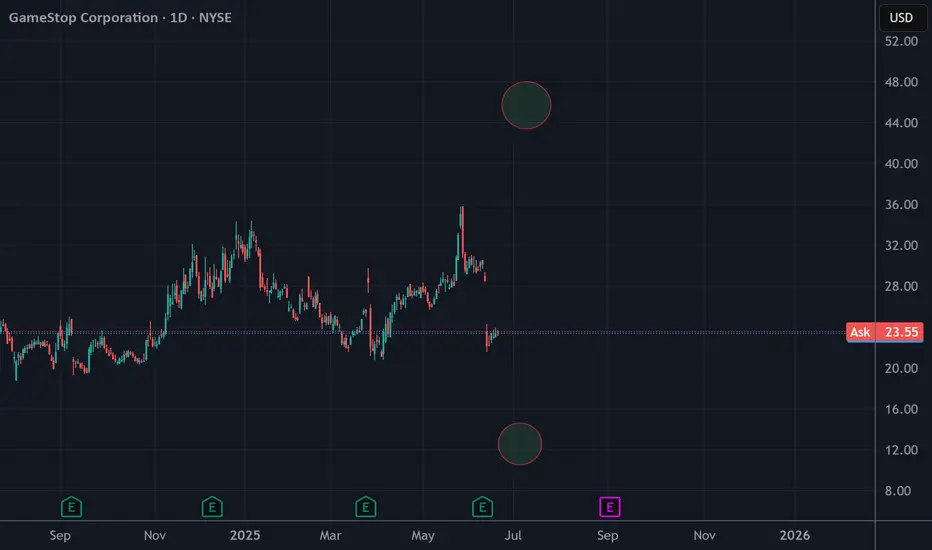
GME TRENDS AND PRICE TARGETSGME has a neat trend setup where it is sitting around support, with huge downside, but also huge upside. We just saw price gap down and the return sets us up to climb potentially as high as $66.
Good luck GME people.
Contact me for custom charts.
Overall bullish but be careful on this trend break, it is a risky buy.

WC: 22.14 Target: 1800-2400 MOASS: 47k-100K: What Now?As I said in the end of day update yesterday the WEEK OF 06/09 was a doozy.
As part of my #GME20WeekCycle theory that week is significant as it is one of the few dates The Cat specifically "gave us" in his tweets...and serves as significant "line in the sand" from which we should look for significant price improvement (covered in the last 3 video updates) (at least thats my theory)
I expected positive price improvement of course this week...but we got the opposite because of the Convertible offering
Along with that we also got TONS OF VOLATILITY AND VOLUME..which I also expected
So what does the mean as far as the cycle theory goes?
This doesnt change anything for me because I never thought or said that we HAVE to get price improvement during that week..its just what I expected because I anticipated BUY VOLUME to come in
I also was CLEAR in the videos that its not just about the day or week of...its about the WHOLE CYCLE
I specifically talked in last video and in the LIVE on 06/09 about adjusting my expectations and to stop "looking for it all" to happen at one time or any given time..
So again I got 2 out the 3 things I was looking for this week: I got Volume and Volatility..just no Positive Price improvement...YET :)
Looking forward I expect the same thing to transpire as the last Convertible offering: Significant Positive Price Improvement
Last time we saw a 72% run from April low to May high
This time I expect 100% move before we see a significant retracement BUT we do need to watch the 38 LEVEL carefully as its a PRIME AREA for retracement due to the presence of overlapping 1.00 extensions....yeah definitely need to watch that area
And yes we are still in a MASSIVE diagonal pattern so look for the ABCs and continue to expect DEEP RETRACEMENTS of ANY significant moves up
GME DECODED
Expanded View of Cycles
Fib Focused Chart. Yellow Vertical lines are FUTURE POTENTIAL PRICE PIVOTS (I absolutely believe these to be powerful)
Above EACH horizontal white line is a Zone of Low Liquidity. There is nothing above 32 but there is also NOW NOTHING ABOVE 22. Once price gets going higher this becomes a VERY REAL PROBLEM FOR SHORTS i.e. why we are getting EPIC SHORTING between 32-34
Next Week. Short Term levels im watching
GOOD TRADING TO YOU ALL!!!

GME Stock Updated with My Personal Code (MOASS)
This is not a financial advice but I love share what my code give to me ..
This is a continue in testing my code for GME stock, it seams this will go to the moon but need (Good News ) in the coming weeks and we will see a big MOASS.
NYSE:GME
