HCW trade ideas

WELL t.a. & set up 9.17.19WELL WELL WELL Showing signs of a a continuous uptrend pattern overall and currently trading above the 200sma on the daily chart. Price history shows SMA50 is known to act as a major support when there is a pull back during an uptrend. Potential long position available. Price gapped up today showing signs of strong momentum and intraday price has now broken above multiple key moving averages the EMA21 and EMA10. Might be a good idea to monitor until close to avoid getting stopped out because of intraday noise. Potential entry would be if price closes today above the ema21 and ema10 moving averages.
Target entry: 88.70 area
Target exit: 92 area @ +4%
Stop: 87.89 -1% (if price closes below ema21 & ema10)
Risk/Reward ratio optimal @ 4:1

WELL approaching support, potential for a bounce!
WELL is expected to drop to 1st support at 82.58 where it could potentially react off and up to 1st resistance at 86.92.
Trading CFDs on margin carries high risk.
Losses can exceed the initial investment so please ensure you fully
understand the risks.

WELL approaching resistance, potential drop! WELL is approaching our first resistance at 78.05 where we are expecting a drop to our first support level. Stochastic is also seeing a nice bearish divergence as well.

WELL is approaching resistance, potential drop! WELL is approaching our first resistance where we expect a drop below this level to our first support level. Stochastic is also approaching resistance where we might be seeing a drop below this level.
WELL approaching resistance, potential drop! WELL is approaching our first resistance where we might see a reversal in price to our first support level. Stochastic is also approaching resistance.

WELL Reversed Off Its Resistance, Potential Drop!WELL has reversed off its resistance where it could potentially fall to its support


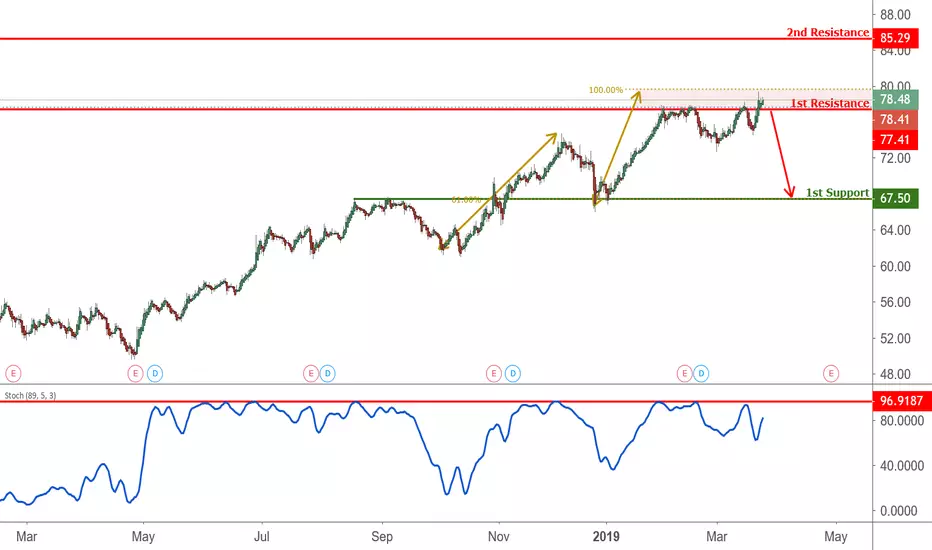
WELL approaching resistance, potential drop! WELL is approaching resistance at 77.41 (horizontal swing high resistance, 100% fibonacci extension, 78.6% fibonacci retracement) and a strong drop might occur to our first support at 67.50 (horizontal overlap support, 61.8% fibonacci retracement).
Stochastic (55,5,3) is also approaching resistance.

WELL Approaching Resistance, Potential Reversal WELL is approaching its resistance at 77.53 (100% Fibonacci extension, 78.6% Fibonacci retracement, horizontal swing high resistance) where it could reverse to its support at 67.50.
Stochastic is also approaching resistance at where a reversal could occur.

WELL Bounced Off Support, Potential Rise!WELL bounced nicely off its support at 66.06 (61.8% Fibonacci retracement, horizontal swing low support, channel support) where it could potentially bounce to its resistance at 73.77 (horizontal swing high resistance).
Stochastic (55, 5, 3) is bounced off near its support at 6.9% where a corresponding rise could occur.

WELL Approaching Resistance, Potential Reversal!WELL is approaching its resistance at 77.93 (100% Fibonacci extension, 78.6% Fibonacci retracement, horizontal swing high resistance) where it could potentially reverse to its support at 67.84 (61.8% Fibonacci retracement, horizontal pullback support)
Stochastic (89, 5, 3) is testing its resistance at 98% where a corresponding reversal could occur.

WELL Approaching Resistance, Potential Drop! WELL is approaching our first resistance at 72.13 (78.6% Fibonacci retracement, 61.8% Fibonacci extension) where a strong drop might occur below this level pushing price down to our major support at 67.34 (100% Fibonacci extension, 50% Fibonacci retracement).
Stochastics (89,5,3) is also approaching resistance where we might see a corresponding drop in price.

Sell WellDaily shooting star plus red outside engulfing
Weekly hammer with red star at the top after impulse wave
Looks like a corrective wave to confirm
MACD confirm downtrend
Stoch trigger twice oversold, heading to down
ATR 1.46
S/L 71.33
T/P 64.00 (using weekly ichi)
R/R 3.92 Nice!
Profit Trading!

Well on watch for longDB is building, no confirmation yet.. anticipating or participating is the question.. I will need some more confluence....

HCN/WEL - Longterm H&S formation short from $67.47 to $54.20/$28HCN formed a beautiful longterm H&S formation. Money flow heading down. We think it has Long-term downward potential.
To play this we would look at $47.50 January 2019 Puts currently $2.75
* Trade Criteria *
Date First Found- November 27, 2017
Pattern/Why- H&S formation in weekly frame
Entry Criteria- current price ($67.47) (hit November 28, 2017)
Exit Criteria- 1st Target $58.20 (Hit February 1, 2018), 2nd Target $54.20 (Hit February 9, 2018) and Long term Target $28
Stop Loss Criteria- $60.43 (updated February 5, 2017)
Indicator Notes- Very poor Financial ratios (P/C: 105.23, P/FCF:110)
Special Note- Would look at $47.50 January 2019 Puts currently $2.75.
Please check back for Trade updates. (Note: Trade update is little delayed here.)
