HOOD WEEKLY TRADE IDEA – JULY 21, 2025
🪙 NASDAQ:HOOD WEEKLY TRADE IDEA – JULY 21, 2025 🪙
📈 Flow is bullish, RSI is aligned, and the options market is betting big on upside.
⸻
📊 Trade Setup
🔹 Type: Long Call Option
🎯 Strike: $118.00
📆 Expiry: July 25, 2025 (4DTE)
💰 Entry Price: $0.68
🎯 Profit Target: $1.36 (💯% Gain)
🛑 Stop Loss: $0.41 (~40% Risk)
📈 Confidence: 75%
🕰️ Entry Timing: Monday Open
📦 Size: 1 Contract (Adjust to risk tolerance)
⸻
🔥 Why This Trade?
✅ Call/Put Ratio = 1.83 → Bullish sentiment
✅ Strong Open Interest at $116 and $118 strikes → Institutions leaning long
🧠 RSI aligned → Technical confirmation of trend
💥 VIX stable → Favors long premium trades
📈 All models rate this as bullish, despite weak volume
⸻
⚠️ Key Risks
🔸 Volume light – fewer confirmations from broader market
⏳ Only 4 DTE → Theta risk accelerates fast after Wednesday
🛑 Tight stop is key – don’t hold through a drift
📉 Exit before Friday’s decay spike unless target is in sight
⸻
💡 Execution Tips
🔹 Get in early Monday — best pricing pre-momentum
🔹 Trail if up >30–50% early in the week
🔹 Exit by Thursday EOD unless strong momentum
⸻
🏁 Verdict:
Momentum + Flow + Technicals align.
Just don’t let the time decay catch you sleeping.
NASDAQ:HOOD 118C – Risk $0.41 to Target $1.36 💥
Clean setup. Strong structure. Watch volume confirmation midweek.
⸻
#HOOD #OptionsTrading #CallOptions #WeeklySetup #TradingViewIdeas #GammaFlow #BullishFlow #UnusualOptionsActivity #ThetaRisk #Robinhood
HOOD trade ideas

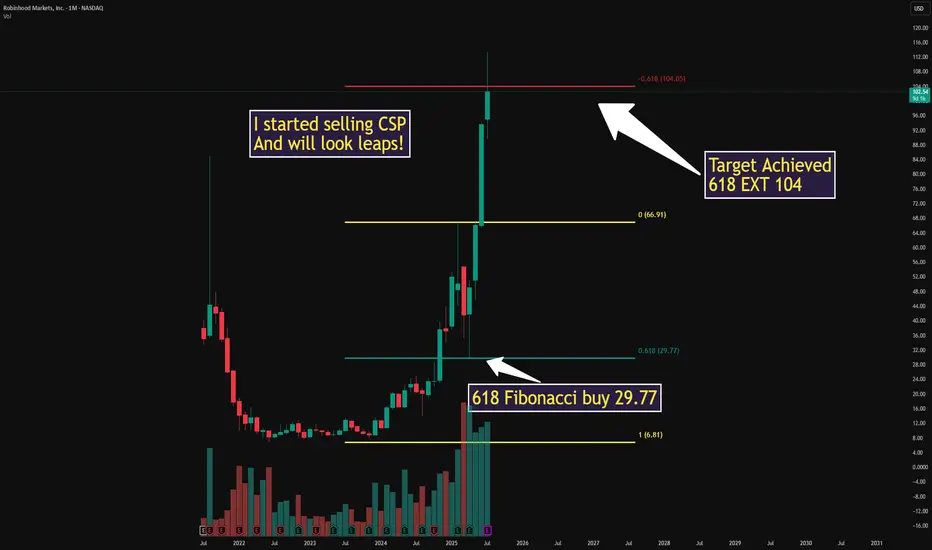
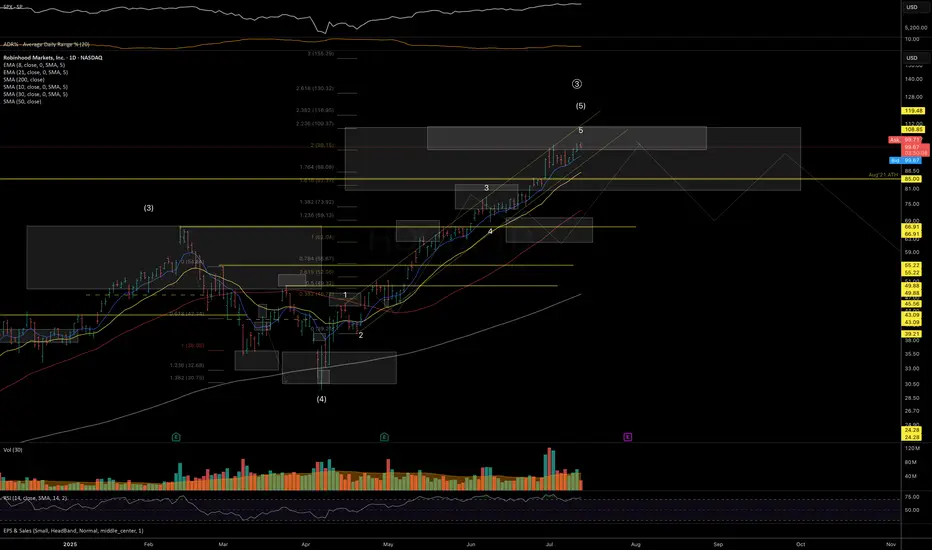
$HOOD ONCE IN A LIFETIMEAs discussed we hit the measured move Fibonacci target from 29.77 to 104
This pullback is EXPECTED TO TRAP CHASERS
I entered into cash secured puts then will add LEAPS as we pull back
ALL WILL BE ALERTED HERE NO CHARGE just LIKE this post!
Everyone's Bullish On Robinhood - But Its Time To SellRobinhood NASDAQ:HOOD has seen an incredible rally over the past year, rising more than 500% since August 2023. Much of this surge has been driven by renewed crypto enthusiasm—sparked by Circle’s IPO—and Robinhood’s aggressive push into new products across fintech and crypto.
But despite strong financial performance, we now believe the stock has run too far, too fast.
💰 Strong Fundamentals, But Slowing Growth
Robinhood’s recent financials are undeniably impressive:
Trailing 12-month revenue: $3.27B (up ~60% YoY)
Net income: $1.59B
Operating income: $1.2B
Revenue from commissions and interest income has outpaced expenses, resulting in high margins. But looking ahead, earnings-per-share (EPS) growth is expected to slow. Analysts forecast mid-teens EPS growth in 2026 and 2027, with a potential dip this year as one-time tax benefits roll off.
Robinhood Gold, the company’s premium service, is growing steadily (ARR projected to top $250M this year), but it’s still a small slice of total revenue.
🛠️ Product Expansion or Strategy Drift?
Robinhood is launching a wide array of new offerings—from robo-advisors and AI tools to crypto products in Europe and futures trading in the U.S.
The issue? These launches feel disjointed. U.S. users get a full-featured experience with stocks, options, crypto, and banking tools. UK users are limited to U.S. stock trading, with balances held in USD. In Europe, Robinhood leans heavily into crypto.
While the company claims it’s building a “global financial ecosystem,” the rollout has been inconsistent and confusing. This scattered approach may dilute brand clarity and user trust.
📊 Valuation: Sky-High and Hard to Justify
At current prices, HOOD trades at:
26x revenue
54x trailing earnings
74x forward earnings
At over 45x FY3 earnings, higher than fintech peers like SoFi (29x), Etoro (20x), and Interactive Brokers (27x)
The only comparable valuation is Coinbase (COIN), which has a more dominant position in crypto and stronger institutional traction. Given that most of HOOD’s revenue still comes from traditional brokerage services, this crypto-fueled valuation seems overblown.
🚨 Bottom Line
Robinhood remains a promising long-term company, but its stock looks overheated. Slowing earnings growth, a scattered international strategy, and a sky-high valuation point to limited upside from here.
Verdict: Sell
Investors sitting on big gains may want to take some profits while the euphoria lasts.

Party Over? Time to get back to senses!- NASDAQ:HOOD valuation is way stretched and it should correct to a reasonable valuation.
- This needs correction. Let's see how it folds out in next 6-12 months

HOOD TIME FOR BOUNCE?HOOD on a 4 day pullback. Some big call flow just came in 105C 8/1/25 @ 4.40 $3.5 million in 4 orders.
Using the Fractal Alligator IndicatorAccording to the Fractal Alligator in TradingView, we have come to a top/peak of HOOD stock price.
Using a 4 hour chart we can clearly see that green triangle, marking our top.
However when viewing the daily chart, there is no "top" green triangle.
This indicator is great, if you try it on different timeframes.
Give it a try and comment here for more feedback on this indicator.

$HOOD Swing Trade – Riding the Rocket or Chasing the Wick?
🚀 NASDAQ:HOOD Swing Trade – Riding the Rocket or Chasing the Wick? 📈
📅 Posted: July 18, 2025
💡 Strong momentum, but no institutional push – is this the top or just getting started?
⸻
🧠 Multi-AI Model Summary
Model Consensus 🟢 Cautiously Bullish
RSI (Daily): 78.5 → 🚨 Overbought territory
5D/10D Perf: +8.49% / +9.29% → 🔥 Hot trend
Options Flow: Neutral (1:1 call/put) → 💤 No strong hands
Volume: Avg (1.0x) → ❌ Weak confirmation
VIX: Low (<20) → ✅ Swing-friendly environment
“Momentum is there, but it’s skating on thin volume. Institutions are silent. Proceed with caution.”
⸻
🎯 Trade Setup – HOOD Call Option
• Strike: $110.00
• Expiry: August 1, 2025
• Entry Price (Premium): $6.30
• Profit Target: $8.10 (≈ +28.6%)
• Stop Loss: $3.80 (≈ -40%)
• Size: 1 contract
• Confidence: 65%
• Entry Timing: At market open
• Key Watch Zone: Needs breakout above $108 with rising volume for confirmation
⸻
⚠️ Risk Radar
• 📉 RSI 78.5 = high pullback risk
• 🧊 Volume lacks institutional bite
• 📊 Neutral options flow = market unsure
• 🔄 No trade? → If price opens flat or drops below $106 with low volume — sit out
⸻
🧪 Strategy Tip
This is a momentum-chaser’s trade, not a conviction play. If you’re in, monitor aggressively. Take partial profits if momentum fades.
⸻
📊 TRADE SNAPSHOT
{
"instrument": "HOOD",
"direction": "call",
"strike": 110.0,
"expiry": "2025-08-01",
"confidence": 0.65,
"profit_target": 8.10,
"stop_loss": 3.80,
"size": 1,
"entry_price": 6.30,
"entry_timing": "open",
"signal_publish_time": "2025-07-18 14:04:07 UTC-04:00"
}
⸻
🔁 Like + Repost if you’re watching HOOD’s next move
💬 Comment below: Momentum magic or rug risk?

HOOD Weekly Options Setup – July 22, 2025
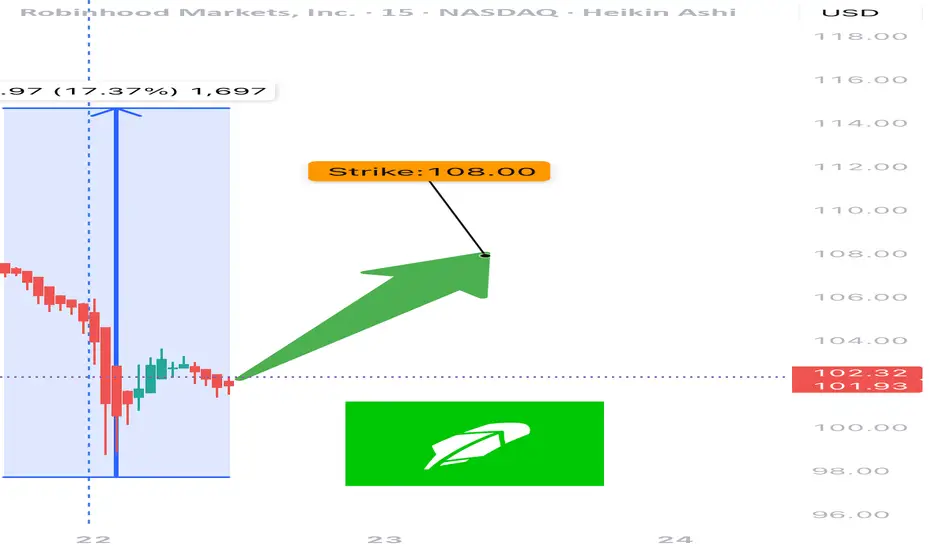
🔥 NASDAQ:HOOD Weekly Options Setup – July 22, 2025
Moderate Bullish Flow | RSI Divergence | 3DTE Tactical Setup
⸻
🧠 Summary Thesis:
While the call/put ratio (1.42) and favorable VIX (16.9) suggest bullish sentiment, fading RSI and neutral volume raise tactical caution. This setup is not for passive traders — it’s for those managing risk and chasing reward with intention.
⸻
📊 Trade Details
• Instrument: NASDAQ:HOOD
• Direction: CALL (Long)
• Strike: 108.00
• Entry: $0.89
• Target: $1.50 – $2.00
• Stop Loss: $0.45
• Expiry: 07/25/25 (3DTE)
• Position Size: 2.5% of portfolio
• Confidence: 65%
• Entry Timing: Market Open
⸻
🔍 Technical + Options Context
Signal Type Status
📈 Call/Put Ratio ✅ Bullish (1.42)
💨 VIX ✅ Favorable (16.9)
🔻 RSI ❌ Falling – Weak Momentum
🔇 Volume Ratio ⚠️ Neutral (1.0x)
⚡ Gamma Risk ⚠️ Moderate – 3DTE decay
⸻
📍 Chart Focus
• Resistance Zone: $108–$109
• Put Wall Support: $100 (OI heavy)
• Watch for: RSI divergence, gamma squeeze attempts
⸻
📢 Engagement Hook / Caption (Use on TV or X):
” NASDAQ:HOOD bulls are pushing 108C into expiry. Volume’s flat, RSI’s falling — but gamma might still flip the board. Risk-defined lotto or fade?”
💥 Entry: $0.89 | Target: $1.50+ | Expiry: 07/25/25 | Confidence: 65%
⸻
🎯 Who This Trade Is For:
• Short-term option scalpers looking for 1.5–2x payoff
• Traders able to manage theta/gamma into late-week expiry
• Chartists watching RSI divergence vs options flow tension
⸻
💬 Want a debit spread version, an OTM gamma scalp, or my top 3 lotto setups this week? Drop a comment or DM. I share daily flow breakdowns and AI-verified trade ideas.
⸻
This format hits all key signals:
• Informative enough for serious traders
• Viral hook for social platforms
• Clear CTA for engagement & leads
HOOD - Get Great PricingNASDAQ:HOOD and I have had a mixed relationship over the years. I have had my biggest win on the HOOD brokerage (5,000% options trade, $1200 into 60k) and at the same time I was present for the Derogatory removal of the GME button (of which I had sold before they took that button).
After many years and brokerages, I find myself returning to HOOD but this time much more experience... To my surprise, I love the platform, and I still recommend it for new traders for the ease and UI. Honestly, unless you are dealing with BIG Volume or Hot-Keying out of Low float Penny stocks, It will suit you just fine.
Now Let's Talk HOOD.
In this MASSIVE range we are looking at High $67, and a Low of $35. Thats a 47% drop!
Although we have recovered a bit, Many are eager to find a way to get in the range. Here I have put together 2 scenarios to help you play your position with confidence.
Better Price = Better psychology
Whether we are shopping at grocery store, or if we are buying a car. Getting a good deal feels better. But how do you feel when you know you overpaid?
TLDR: The best deals are the lowest purple zone "Extreme Demand" if you are Long, "Reinforced Supply" (at the top) if you are looking to get short or take profit.
Under the HOOD
Currently Robinghood is running into a little bit of a supply zone labelled "Weak Supply"
This is a new player, and we don't yet know how just how big this player is. So far they have absorbed some of that buying pressure coming in, but I would not be surprised if they we overtaken or even gapped above come Monday. This brings us to our first Scenario
Scenario 1: Blue line
With the break above "weak supply", there is headroom all the way until 51.74. This is where we will see some supply initially and maybe a small rejection.
Why would it not reject back down to a demand area like 41? Great question.
If this overtakes that "Weak Supply" zone, this will make a strong case that there is momentum behind the wheels here. I think there will be a new player reinforcing this buying if this happens all the way to the Finale at $58.01. From here I would consider taking some profits, maybe partials, or looking for some Puts.
Scenario 2: Red line
Getting Rejected by "Weak supply" would be evidence that this move was fluff. Those two demand zones may try to hold a bit, but with the lack of buying interest in the
$45 area, this won't make those buyers feel confident.
This is different story when comparing to the "Extreme Demand" zone (lowest purple zone). Buyers here have PROVEN that this is something they are very interested and they are not done accumulating yet. So from this location buyers feel confident that they are getting a good price*( see fn. )
From here this should drive demand up again, crushing shorts, and sending another nice squeeze to test that supply at 51.71
WHEW! if you made it this far, I appreciate your time!
Upvote/Follow if you enjoyed this idea, there are many more to come!
Happy trading!
* (This is a good price, because buyers are showing that it is. Although, if it did come down here, this would be the 4th test of this area. I still think there will be strong demand here, but this isn't the best tests. 2nd and 3rd were stronger.)

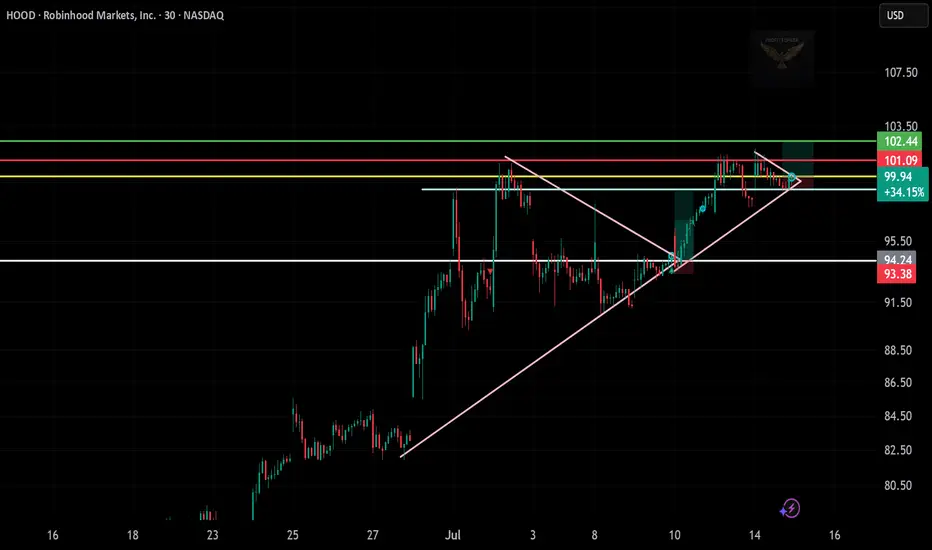
HOOD Breakout Watch – Eyeing $103+
🧠 Chart Breakdown:
Setup: Price broke out of a large ascending triangle and is now forming a mini symmetrical triangle — a consolidation before a possible continuation.
Current Price: $99.94
Breakout Zone: Near $100, close to decision point.
📊 Key Levels:
Immediate Resistance:
$101.09 (yellow)
$102.44 (first green target)
$103.50 (final target zone)
Support Levels:
$94.74 (white line)
$93.38 (stop-loss zone)
🎯 Trade Idea (Bullish Bias):
Entry: $100.00
Target 1: $102.44
Target 2: $103.50
Stop-Loss: Below $94.74
Trade Idea: $HOOD – $106C by 7/25 | Bullish Setup🧠 Thesis:
After topping out at $100, NASDAQ:HOOD pulled back ~10%. I believe this recent pullback sets up a healthy base for a continuation move back toward $100+ in the coming sessions. If momentum kicks in, we could see a push toward the $106 level by expiration.
📊 Key Levels:
Resistance: $95.60 → $97.34 → $99.77 → $102 → $106
Support: $94.00 (uptrend line), $92.97 (higher low), $90.97 (must hold for bulls)
📌 Trade Strategy:
I'm scaling into the $106 Calls expiring 7/25.
Looking for:
A breakout above $97.34 to trigger upside momentum
Profit-taking zones around $99.77 and $102
Final target near $106 (ITM zone)
Risk is managed below $92.97.
🧭 Notes:
Watching broader market sentiment and NASDAQ:QQQ correlation closely. Volume confirmation will be key on any breakout attempts.

RobinHood Markets: Stay heavy on positionsHOOD position size is adjusted in line with US market signals for underweight or overweight allocations. During panic phases, 2x leverage ETFs are on the table
Stay heavy on positions.

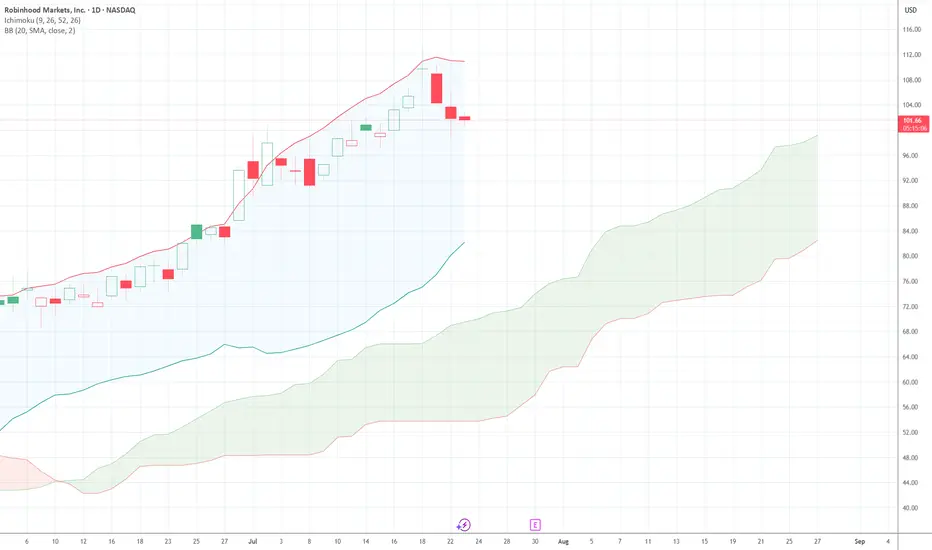
HOOD — In Key Macro Resistance ZonePrice has reached a major resistance zone, with the 110 level marking an ideal spot where downside pressure may begin to dominate and a mid-term top could start forming. Macro support for the macro-uptrend structure is at the 80–65 area.
Hedging near current levels may be prudent - especially ahead of earnings and while volatility remains relatively cheap.
Weekly view
Daily view:
Thank you for your attention and I wish you successful trading decisions!
HOOD Weekly Call Option Setup – 07/14/2025 $106C | Exp. July 18
📈 HOOD Weekly Call Option Setup – 07/14/2025
$106C | Exp. July 18 | Breakout Watch Above $100 👀
⸻
🔥 BULLISH MOMENTUM BUILDING
🟢 HOOD is pushing hard into $100 resistance — price riding above 10/50/200 EMAs on all timeframes.
📊 RSI hot (65.6 on 5m / 71.6 daily), but not maxed out — short-term pullback possible, but trend still bullish.
💰 Volume + call flow favor more upside.
⸻
📰 Catalyst:
Positive crypto market sentiment = increased trading activity = good for HOOD’s core business.
VIX at 16.40 = risk-on environment = perfect for high-beta names like this one.
⸻
🎯 Trade Plan – High R/R Call Setup
Clean structure, riding sentiment — but be quick around $100.
{
"ticker": "HOOD",
"type": "CALL",
"strike": 106,
"exp": "2025-07-18",
"entry": 0.92,
"target": 1.38,
"stop": 0.46,
"size": 1,
"confidence": "70%",
"entry_timing": "market open"
}
🔹 Entry: $0.92
🎯 Target: $1.38 (+50%)
🛑 Stop: $0.46 (-50%)
📅 Expiry: 07/18/25
📈 Confidence: 70%
💼 Strategy: Naked Call
⸻
💬 Model Consensus:
“Moderately Bullish” — clean momentum + bullish call flow = good entry.
⚠️ Watch RSI + $100 resistance — quick rejection is possible.
⸻
📌 Why $106C?
🔸 OI building there → potential magnet
🔸 Cheaper than ATM but within reach
🔸 High gamma setup if we break $100 early
⸻
💡 Trade Smart:
🏃 Get in early → fade into strength
🧠 Position size accordingly → don’t get greedy
📢 Tag your trading buddy who’s still ignoring HOOD 😏
#HOOD #OptionsTrading #BreakoutSetup #CryptoMomentum #AITrading #CallOptions #FlowPlay #TradingView #0DTE #
What’s Your Catalyst?
Lately, many QS members have been DM’ing me asking:
“What do you think of this trade idea?”
“Should I go long here?”
“Do you think this setup looks good?”
And my go-to response is always the same:
“What’s your catalyst?”
Because without a catalyst, you’re not trading — you’re guessing.
---
🎮 Trading Is Not a Video Game
New traders often treat the market like it’s a video game.
As long as they “crack the code” of green arrows and red arrows on the chart, they believe they’ll make infinite money.
But that’s not trading.
That’s fantasy.
The harsh truth? Most of these traders haven’t paid their tuition yet.
Some are still in the honeymoon phase.
But the market always gets paid — in blood, time, or money.
---
💀 Real Trading Is Financial Warfare
Trading is not a game.
It’s war.
Behind every price tick, every candle, every fill — is another trader fighting for their financial life.
It’s a sword-to-sword battle. Just because you see it on your phone doesn’t mean it’s not real.
Real trading is life and death for hedge funds, prop firms, and even retail traders trying to survive.
Yet so many jump in, chasing arrows and patterns like they’re spinning a slot machine.
---
🎲 Why You’re Losing with “Green Arrow, Red Arrow”
No offense to TA — it has value. But let’s be honest:
If you’re blindly betting off green and red signals without context, you’re gambling.
You’re just hoping that one of those arrows lines up with a rare, random outlier move — so your one win is big enough to cover all your prior losses.
That’s not strategy.
That’s survival through luck.
---
🔍 What Real Traders Do Differently
To stand out, you need more than pretty charts.
You need information. Insight. Intent.
You need to answer questions like:
Why is this price movement happening?
How far can it go?
What’s driving this move — and what’s the broader context?
You won’t find those answers in price and volume alone.
---
💡 The 4D Framework of Modern Trading
To get an edge, you need to think in 4 dimensions — beyond what most retail traders see:
Market Data – price, volume, trends
Fundamentals – earnings, balance sheets, growth
Macro Forces – rates, inflation, policy, geopolitics
Catalysts – news, events, industry changes
Options Data – implied vol, skew, positioning
This 4D perspective is how modern trading works — and it’s exactly what AI is built to do better than any one trader.
You’re not going to out-research Goldman Sachs.
You’re not going to manually read every 10-K, earnings call, tweet, and Fed update.
But AI can.
---
🤖 AI Isn’t Perfect — But It’s Better Than Gambling
Is AI trading the ultimate answer?
No.
But it’s the closest thing we have to a scalable edge — because it combines massive information processing with human-level reasoning.
The choice is yours:
Stick with “green arrow, red arrow” and hope for Vegas-style luck
Or embrace AI tools that give you a fighting chance through context and analysis
I’ve made my choice.
And every day, my tools — and my edge — get better.
---
🧠 So Next Time You Trade, Ask Yourself
What’s your catalyst?
If you don’t have one, you don’t have a trade.
You have a lottery ticket.

$HOOD Long Trade Setup – July 10📊
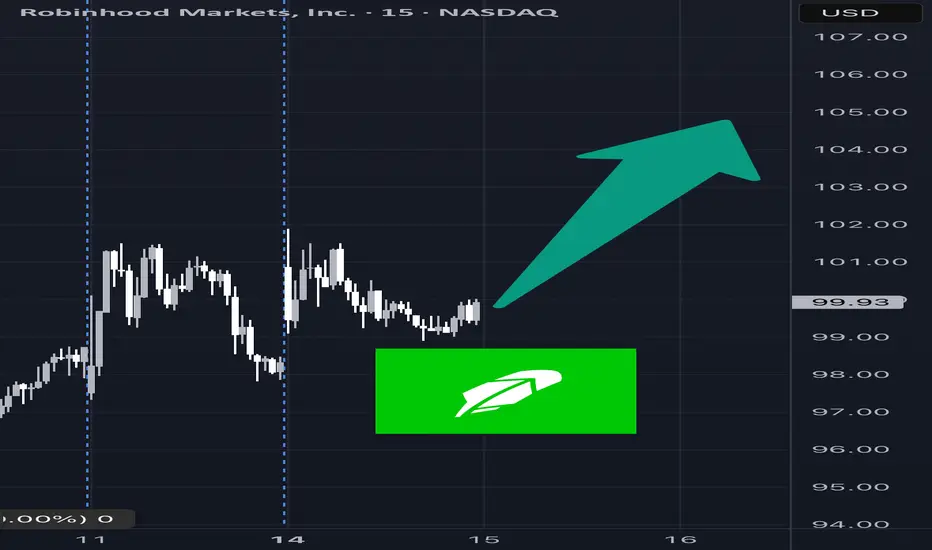
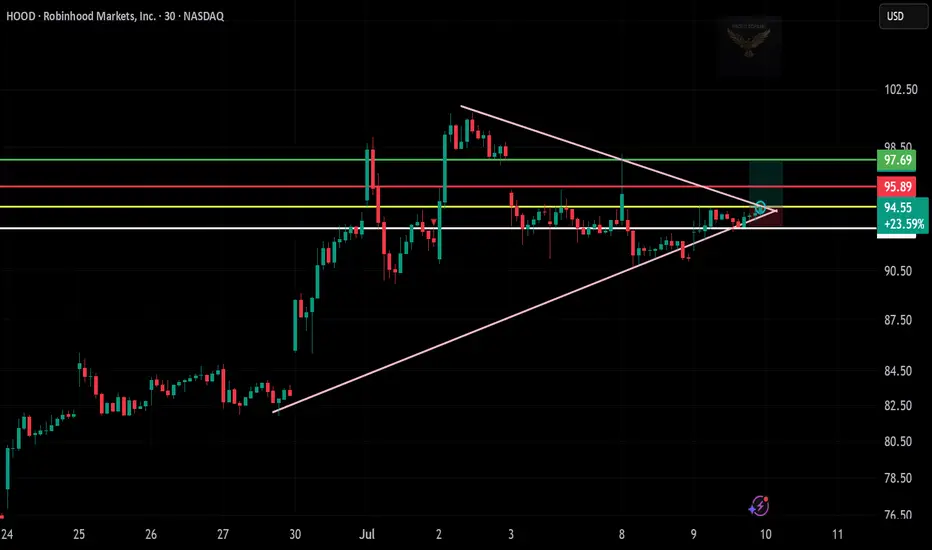
Price is squeezing inside a triangle — and today it broke out!
Volume picking up, and it’s holding above trendline support.
📌 Entry: $94.55
🎯 Target: $97.69
🛑 Stop Loss: Below $93.50
⏱️ Timeframe: 30-min
🔍 Why I Like This Trade:
Symmetrical triangle breakout with strong candle
Clean support build-up above $91.50
High R:R zone with room toward recent highs
Let’s see if momentum takes it to the target!
Logging every setup, win or lose, to sharpen the edge.
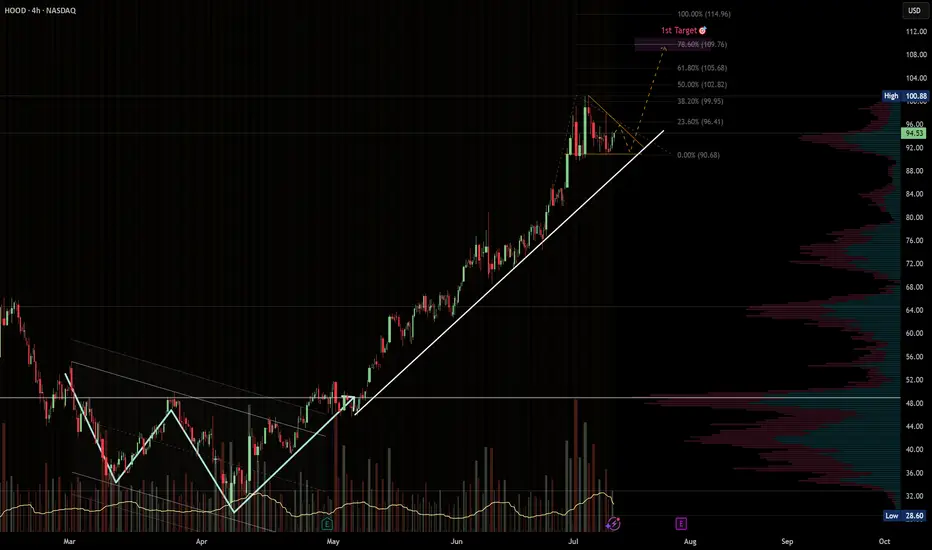
HOOD · 4H — Bullish Continuation Setup Targeting $109 → $115Pattern Overview
HOOD has been riding a strong ascending trendline since early May, respecting higher highs and higher lows all the way up.
After the most recent parabolic move from ~$90 to ~$101, price is now consolidating in a bullish pennant, just above key fib levels.
The setup looks primed for continuation if we see a breakout above $101 with confirming volume.
---
🎯 Target Zones
🎯 Target Level Why It Matters
Target 1 $109.76 78.6% Fibonacci extension from the previous leg. Common spot for intermediate take-profit. Also matches a soft VPVR resistance area.
Target 2 $114.96 100% measured-move projection of the prior rally. If momentum accelerates, this becomes a realistic stretch zone.
---
🛠️ Trade Plan (Example)
Component Level
Trigger Break and hold above $101 with volume ≥ 20-SMA.
Add-on Opportunity Pullback into $96–97 that respects the rising trendline.
Stop-loss Close < $92.5 invalidates trendline.
TP-1 $109–110 — take partials, move stop to breakeven.
TP-2 $114–115 — full exit or runner trail zone.
---
⚠️ Risk Notes
Watch for false breakouts — confirmation needs volume and price stability above $101.
Earnings or macro news could override technicals. Use tighter stops ahead of event dates.
If trendline fails, next key support sits at $89–90 (previous consolidation base).
---
✅ Trade Checklist
Bullish trendline intact
Continuation pennant forming
Fib & measured move confluence at $109–115
Volume profile supports clean move above $101
Clear invalidation under $92
> Disclaimer: This is not financial advice. Always trade your own plan and manage risk appropriately.
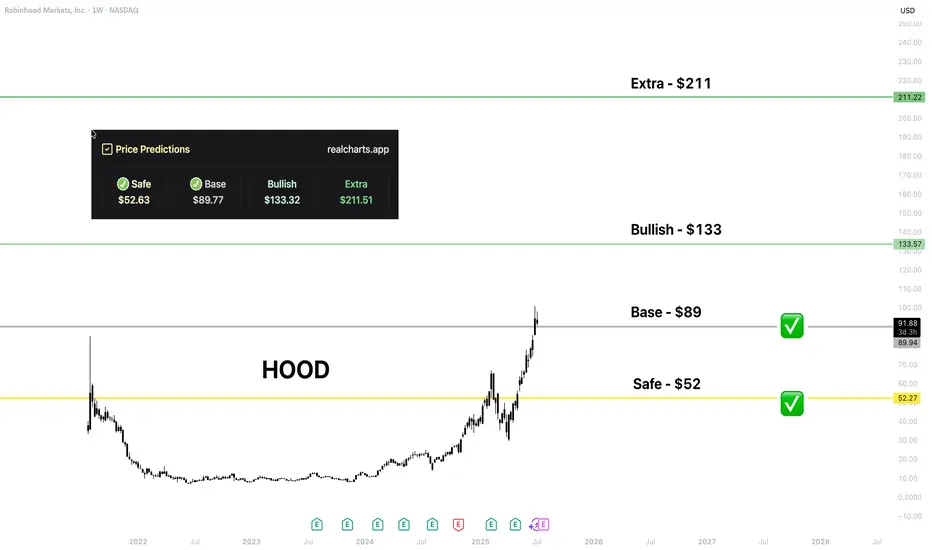
HOOD | Price PredictionI love that NASDAQ:HOOD has made a huge step in crypto integration.
That level is from my platform. I hope HOOD holders would be happy to get every level; time will show!
$BULL from $HOOD charting for maximum gains. 50$ reclaim this is a great risk to take here and i beleive can benefit alot of beginner traders to increase there first bag!
bag dad

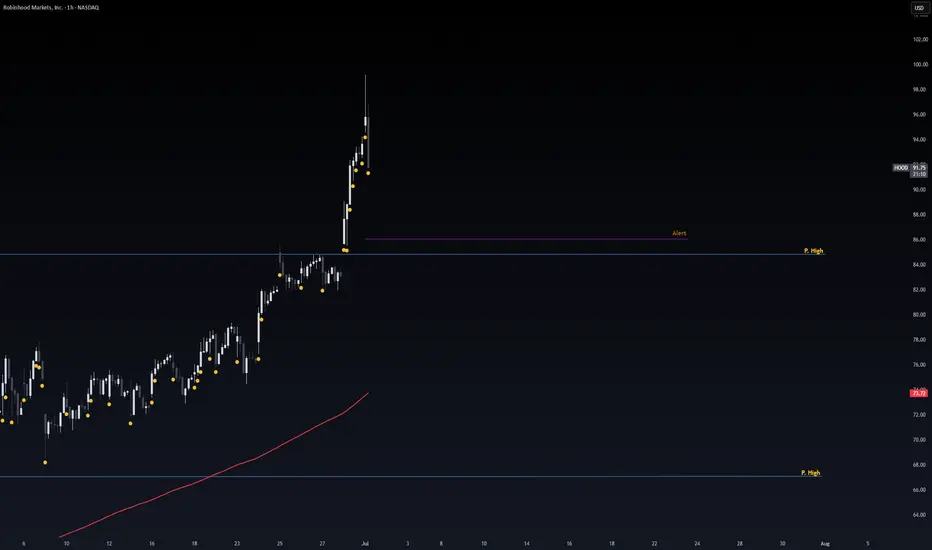
Safe Entry Zone HOODP.High (Previous High) Act as good support level.
Waiting for Buying Power to Stepin at P.High Line.
Note: 1- Potentional of Strong Buying Zone:
We have two scenarios must happen at The Mentioned Zone:
Scenarios One: strong buying volume with reversal Candle.
Scenarios Two: Fake Break-Out of The Buying Zone.
Both indicate buyers stepping in strongly. NEVER Join in unless one showed up.
2- How to Buy Stock:
On 1H TF when Marubozu/PinBar Candle show up which indicate strong buyers stepping-in.
Buy on 0.5 Fibo Level of the Marubozu Candle, because price will always and always re-test the imbalance.
Short Trade Idea: HOOD (Robinhood Markets, Inc.)🧠
📅 Timeframe: 30-Minute
💼 Type: Short Position
📉 Setup: Triangle breakdown + Resistance rejection
📍 Trade Details:
Entry: $92.33 (bearish rejection candle at resistance + lower trendline break)
Stop Loss: $95.33 (above local high & upper trendline)
Target 1: $89.47 (previous support level)
Target 2: $86.64 (mid-support zone)
Target 3: $83.89 (key horizontal support)
Extended Target: $81.66 (major support from breakout zone)
🔎 Technical Breakdown:
Price formed a rising wedge/triangle and broke the lower trendline
After rejecting $95+ zone, it failed to hold above yellow resistance line
Bearish engulfing + retest of broken support confirms downside pressure
Momentum fading after a strong uptrend – ideal for a reversal trade
🎯 Risk/Reward Outlook:
RR Ratio: Favorable (min 2:1+ depending on targets)
Good structure for tight risk and wide target zone

VLAD impaling WALL ST!I believe Robinhood will achieve over One Trillion dollars in assets in very short order.
Giant Cup and Handle is your technical setup.
(I have covered hood at the low)

HOOD Got away #2I swear man, I said anything under 10 and I was loading up..... I did start but then I went all in on NASDAQ:TSLA and here she is another 10 bagger has come and gone. Lesson is Diversify, well sorta. If there's not catalyst for other stonks making big moves then put some here and there. I'm going to buy into this again in the future it's growing like a mofo.
