HOOD looks ready for 2x returnsStrong FA and TA, chart looks great. Think the narrative that the younger generation uses them over other platforms will drive up the value
HOOD trade ideas

$HOOD On Track To ReboundWith the macroeconomic stability the US has been witnessing lately, more investors have been returning to the stock market and crypto trading. One of the companies benefitting from this return is leading trading platform Robinhood Markets, Inc. (NASDAQ: HOOD) which is up nearly 32% YTD. With this in mind, HOOD could have more room to grow this year as the company’s crypto trading platform might be gaining market share from crypto trading giant Coinbase Global, Inc. (NASDAQ: COIN) according to analysts. Given the company’s plans to close an acquisition this quarter and its impressive performance so far this year, the HOOD stock forecast appears to be brighter than ever.
HOOD Fundamentals
Gaining Market Share
With the Securities and Exchange Commission (SEC) suing Coinbase for trading unregistered securities, analysts believe that HOOD has been gaining share over Coinbase over the past few months. The reason analysts share that belief is that Coinbase should have realized $117 million in revenues in April according to the current fee Coinbase collects, but in reality, it only realized $110 million.
On that note, Coinbase increased its fee from 1.33% in Q3 2022 to 1.68% at the moment and this increase may be a pivotal reason for customers turning away from Coinbase to HOOD which offers commission-free crypto trading. In this way, HOOD has the potential to increase its crypto trading platform’s market share substantially.
New Acquisition & Cost Cuts
HOOD is also planning to increase the range of financial services it is offering to its customers and add it to its existing cash card product with the planned acquisition of X1 for $95 million in cash, with the transaction expected to close this quarter. X1 is a credit card company that offers instant reward points and does not rely on credit scores for approvals; instead, income is used to determine whether or not an application is approved and the credit limit for the cardholder.
The X1 acquisition is certainly on brand for HOOD since the X1 card has no annual fee, no foreign transaction fees, and no late fees, which is something ingrained in the core identity of HOOD. Furthermore, the acquisition will provide a new revenue stream for HOOD and will offer an opportunity to implement X1 in its brokerage platform especially since X1 was planning to give its cardholders the ability to buy stocks by using earned reward points.
Around the same time HOOD announced its plan to acquire X1, HOOD laid off 7% of its staff to lower its costs, since HOOD has trimmed its guidance for 2023 GAAP total operating expenses to $2.345B-$2.485B from the previous guidance of $2.375B-$2.515B. In this way, HOOD might return to profitability especially with the growing interest in stock and crypto trading due to the improving macroeconomic outlook.
Breaking Out Of A Pattern
On the daily chart, HOOD stock successfully broke out of a falling wedge pattern and confirmed the break with a retest of the wedge’s trendline. With the stock forming higher highs, HOOD could witness an upward trend from current levels which is supported by the platform’s successes this year. For this reason, the HOOD stock forecast could be extremely bullish this year.
HOOD Financials
n its Q1 2023 report, HOOD’s assets increased 20% QoQ from $23 billion to $27.7 billion, while its cash and cash equivalents decreased 14% QoQ from $6.3 billion to $5.4 billion. HOOD’s total liabilities increased by 27% QoQ from $16.3 billion to $20.7 billion.
Revenue also increased 47% YoY from $299 million to $441 million. Operating costs increased almost 37% from $690 million to $950 million, which contributed to the operating loss increase of 30% YoY from $391 million to $509 million. As a result, HOOD’s net loss increased 30% YoY to $511 million.
Technical Analysis
HOOD stock’s trend is neutral with the stock trading in a sideways channel between $8.33 and $10.15 which it has broken recently. Looking at the indicators, the stock is trading above the 200, 50, and 21 MAs which are bullish indications. Meanwhile, the RSI is overbought at 74 and the MACD is bullish.
As for the fundamentals, HOOD has an upcoming catalyst in the closing of the X1 acquisition this quarter. Moreover, HOOD is expected to post its Q2 earnings on August 23 which are critical to confirm whether HOOD has been gaining market share from Coinbase or not.
HOOD Forecast
HOOD is currently seeing a lot of interest, with speculations of it gaining market share over its competitor in the crypto trading space Coinbase. Given HOOD’s efforts to cut its expenses with the last round of layoffs, the platform is actively improving its long-term profitability prospects which would be a major achievement for the company. Meanwhile, HOOD is actively trying to broaden its product offering by venturing into the credit card space with the planned acquisition of X1 which is set to be closed this quarter. For these reasons, the HOOD stock forecast appears to be bright this year.

HOOD breaking outHOOD has broken out of the consolidation. Taken some position, if it sustains above TL, will add more.

$HOOD - A New Generation, A New Bull MarketState of the Stock
Robinhood’s time in the stock market has been an arduous one and not one without controversy. The stock went public in a hotly anticipated IPO at about $36.41 on July 29th, 2021. It saw tremendous interest in the first week of trading reaching an overly lofty value at ~$85 a share before starting to sell off. This sell off has relentlessly continued and in many places, you will find negative commentary on the stock.
I personally believe that the stock’s price action bottomed on June 17th, 2022 at about $6.84 a share. Since then the stock has been slowly plodding along and striking higher lows, which I will illustrate later in the charting.
I also believe that the stock’s story is close to turning around and could get more positive attention in the later half of this year. I am going to talk about the balance sheet, cost cutting, charts, and the controversy.
I will be limiting my comments on the balance sheet to lines that I believe deserve notice. For this post, I will be comparing Robinhood to their old school rival, Charles Schwab.
The Balance Sheet
(See Robinhood's Financials)
Overall, I read Robinhood’s balance sheet as being quite strong. Particularly in the amount of cash and sort term investments that the company is carrying. At 5.46 Billion in cash and 1.52 Billion in short term investments the company can cover operating expenses (excl. COGS) for about 3.5 years.
The company has also shared that the short term investments are in <1 year term treasuries. Which is quite a good decision given the current rates. I only wish they had purchased a little more than 500 million or so.
As of this writing (6-11-23), Robinhood carries a market cap of ~$8.5 billion as well. Their cash position is nearly the size of their entire equity. In comparison,
SCHW
(Charles Schwab) has about $75 billion in cash and a market cap of 100 Billion. I believe that the market is underestimating how Robinhood can deploy that cash.
Lastly, Robinhood is very close (9.41 market) to their book value per share (7.83). In comparison,
SCHW
has a book value per share of 15.36 and is trading at 55.0 in the market. I believe this illustrates that Robinhood is quite cheap, even after the June ’22 bounce when it was cheaper than the book.
(See Robinhood's Financials)
Next, the cashflow at Robinhood is quite good and turned positive in Q4’22. Whereas their rivals are experiencing negative free cash flow during this same period. Robinhood, on a relative basis for this metric, looks to be outperforming during the banking crisis.
During their earnings calls they have also reported a net increase in deposits as well as assets under custody (AUC) increasing by an impressive 26% due to the run on stocks in 2023.
What I find most interesting about this is that customer cash in Robinhood has steadily grown to $11 billion from $2 billion at IPO. It has been on an impressive path of growth. I believe this is the result of their strong “Brokerage Cash Sweep” program and the rates they’ve been able to offer.
They have been able to effectively remove the friction between treasury yield and their customers. This also creates a beneficial situation where their clients can deploy capital quickly, while maintaining some yield from their cash. Effectively, creating productive reserves for their customers who can choose to deploy it at any moment right on their app.
(See Robinhood's Financials)
Lastly, the company itself is quite close to profitability. The next 4 quarters are projected by broader WallStreet to come in at an EPS of about -0.01 to -0.03. Any positive change in their costs or earnings could lead to a surprise profit. Such as cash from treasury yield, cost cutting measures, new products, or increased business. The company itself continues to stress, that they are becoming leaner as time goes on. I believe that to be true.
Cutting Costs – The Layoffs
In 2022, Robinhood performed several rounds of lay offs. This allowed them to cut Q2 ’22 and Q3 ’22 operating expenses significantly (excl. COGS). This does not appear to have impacted their revenue growth and has given them the added benefit of being ‘right sized’. And to the best of my knowledge, no further lay offs are currently on the table. In fact, their revenue is now higher than it has ever been since IPO at $447 million and is pushing them ever closer to profitability.
“Robinhood Is Laying Off 9% of Its Full-Time Employees”
– Wall Street Journal, Apr. 29, 2022
www.wsj.com
“Robinhood Lays Off 23% of Staff as Retail Investors Fade From Platform”
– Wall Street Journal, Aug. 2, 2022
www.wsj.com
2023 Road Map – 4 Catalysts
Now that we’ve talked about cost cutting, let’s take a look at the road map and see if there are opportunities for fundamental growth. I will list out 4 that I believe can have a positive impact on their business.
Options Trading in Cash Accounts
Margin Outside Gold
Futures Trading
UK Market Expansion
Lets tackle the first two on the list.
Options Trading in Cash Accounts should continue to grow their existing business. This should increase their revenue generated per user as more current customers have access to more products. Options trading is particularly popular among Robinhood’s customer demographic.
Margin Outside Gold I find personally controversial. I personally don’t believe in using margin. Regardless, it should also increase their revenue generated per user.
While both of these are improvements that could turn the company profitable for EPS. They are not as major as the next two items.
Futures trading would open an entire new market for the Robinhood user. I believe it is an incredibley potent catalyst for their user base and will allow their customers to trade more often and in new ways.
Robinhood advancing offerings for active traders
In March, we applied for a Futures Commission Merchant license and, if approved on a typical timeline, we
expect to launch futures trading by the end of 2023.
s28.q4cdn.com
UK Market Expansion should allow them to acquire a significant number of new users.
Robinhood continues to explore growth opportunities, expands access globally
With an experienced team leading and an existing license in place, we believe we’re on track for our
ambitious goal of launching brokerage services in the UK by the end of the year.
s28.q4cdn.com
To summarize, I believe expanding into a new country, the UK, and providing futures trading to their existing customers they expand their business significantly over time.
Lets take a look now at the charts and see what we can find in the price action.
Charting A Path
The first thing of note on Robinhood’s stock chart is that a series of higher lows have been put in. The price action, for the first time since IPO, is showing an increasing pattern in the price. I believe the stock has a classic Falling Wedge which I interpret as bullish. I believe the wedge has formed because of the positive developments in the balance sheet, cost cutting, and the future outlook.
Examining the MACD on the 1D time scale we also see higher lows put in as well as an MACD crossover onto the positive scale. Overall, I read the charts as having increasingly positive momentum. I also believe that momentum is growing, albeit slowly.
Lastly, on the 2D time scale my favorite indicator, DMI, shows the bulls having taken control on ~May 24 2023. I don’t think it’s any coincidence that was the low after the most recent earnings report. I believe the majority of the bears have left the stock as evident by their strength at ~11.5. We also have seen the natural termination of the ADX which implies, to me, that the previous trading trend for the stock has come to an end. A new trend does appear to be forming. It could fizzle out, but that’s up to Robinhood’s management.
I believe all of the necessary setups are currently there for them to succeed as both a company and a stock.
Closing Thoughts & Possible Risks
The Demographic & The Controversy
By discussing Robinhood here, I feel that I must mention reddit’s r/wallstreetbets. The community there has a significant impact I believe on Robinhood’s success or failure.
The community has a significant following and many of their members use the app. I believe they are an opportunity for Robinhood as well as a possible risk. The 14 million members are potential customers for the Futures trading introduction as well as the increased margin offerings.
However, the community has aligned itself with being against the Robinhood app and have been in a ‘boycott’ of the app since the
GME
trading saga of early 2021. While the community is very vocal on the matter, many of the posts continue to show use of the Robinhood app. At a minimum, it remains controversial, but still in use.
This has led me to believe that most of the drama has faded and because of the high quality product Robinhood offers, has started to draw users back to the app. I believe this is well illustrated in their MAU and NFA graphs. There’s a unique opportunity here for them to either win back this community or lose them forever.
This could also be related to the flurry of trading activity seen in stocks related to AI in the past few months.
Heavy Insider Selling
An additional risk is that the insiders, specifically Tenev Vladimir, CEO & Bhatt Baiju, Chief Creative Officer, continue to sell large numbers of shares. This is creating an immense downward pressure on the stock price. If this pattern continues, it could contribute negatively to the stocks performance.
However, I believe that’s a non-issue if the company becomes profitable. I hope that we are approaching the end of the insider selling.
Crypto & SEC Action
Additionally, due to recent events, Robinhood has pulled 3 of their crypto offerings. I believe this is another mixed risk. While they will take a revenue hit by delisting those tokens, they may end up gaining users if customers of Coinbase or Binance decide to take their business elsewhere. It could end up being beneficial to Robinhood, but there’s no way of knowing at this time.
At the time of this writing there has been no report that I can find of Robinhood receiving a notice on the matters affecting Binance and Coinbase. Robinhood instead chose to remove the 3 affected securities voluntarily.
I believe this is the responsible thing to do and well advised. By taking pre-emptive action they are protecting their business from getting entangled in the matter and remaining compliant with the SEC. This is a value the company has stated a number of times during their earnings calls. I believe their actions demonstrate that value and is representative of good governance from the company leadership.
That said, the SEC could still take action against the company if they choose to do so. Therefore, it still carries some risk and must be considered.
Macro & Last Thoughts
So, here we are. It’s June 11th, 2023. Costs are significantly reduced and being controlled, notable Roadmap 2023 objectives are close, plans for new markets and offerings are approaching, and revenue continues to grow. The company is just a few pennies away on EPS from breaking even or potentially turning a profit. There is also significant distance from the drama surrounding GameStop, Robinhood, and WallStreetBets.
The charts are showing higher lows being put in place. More positive momentum looks to be coming into the stock via the MACD. Additionally, the bulls appear to have taken control via the DMI on ~May 24th, 2023.
I believe this is a case where a significant breakout could occur. It remains to be seen if it will, but I believe there is a potential trade here to the upside. It is not without downside risk though and that must be taken into consideration.
Current thinking in the market is that we may be entering a new bull market based off of recent SP500 closing levels. However, the macroeconomic picture still remains unclear. Particularly in regards to inflation, interest rates, and consumer spending.
If it is a new bull market, Robinhood may benefit from increased trading activity, but if the macroeconomic picture deteriorates it could degrade Robinhood’s business and affect the stock.
Either way, I personally believe the stock is in an interesting position within the market.
Trade carefully, trade wisely.
~Kryptonite
As always, please consult the appropriate professionals for any financial decisions. I am not a professional. I am an amateur hobbyist. These are my own personal opinions that I’ve expressed regarding the market and the companies mentioned above. I am not responsible for any decision, trade, or investment you may make.
You should assume that as of the publication date of any report, post, or communication referencing any publicly traded security or asset that Kryptonite Research (myself) may have a position in the security or asset and I might stand to realize significant gains if the price of the stock moves. Following publication of any report, post, or communication, I intend to continue transacting in the securities covered therein, and Kryptonite Research (myself) may be long, short, or even neutral at any time thereafter regardless of Kryptonite Research’s (myself) initial position. I reserve the right to alter my position at any time without notice.
Images are sourced from the TradingView app, Adobe Stock photos, and Robinhood’s Investor Relations. I do not claim ownership.
As an additional disclaimer, at the time of this writing I am a Robinhood customer and holding a position in Robinhood’s stock.

HOOD | Robinhood Markets| Another Bullish Wave May Happen SoonHOOD | Robinhood Markets| Another Bullish Wave May Happen Soon
In the previous analysis, price reached both targets that we were focused.
After creating a deep correction again we can see that HOOD is above the wedge
pattern and it may rise again.
This is supported also by the price increase on Indices during these days ahead of FOMC.
Thank you and Good Luck!
Previous Analysis:

Give the Robin another shot! Nice wedge and its been longly forgotten. Growth has been catching a bid - can they see a resurrection?

Trading HOOD to $11+According to TipRanks, the average price target is $11.60 with a high forecast of $25.00 and a low forecast of $8.00. The average price target represents a 24.20% change from the last price of $9.34.
Wait for breakoutHOOD is in symmetrical triangle range. Wait for the breakout in any direction to take the trade. Can give huge move

Robinhood ($HOOD) - Riding High, But Earnings Could Bring a CoolNASDAQ:HOOD Robinhood ( NASDAQ:HOOD ), the popular retail trading app, has seen its stock price heat up over the last four days. However, with upcoming earnings on the horizon, we might see a cooling off period for the stock.
Recent Run:
Over the last four trading days, Robinhood's stock has demonstrated strong bullish momentum. The rising trading volumes and positive price action suggest heightened interest from investors and traders. This kind of rapid price movement often stirs up excitement and speculation, which can fuel further price increases in the short term.
However, Robinhood is set to report its earnings soon. Earnings announcements often bring increased volatility due to the uncertainty surrounding the company's financial performance. If the earnings report falls short of market expectations, it could trigger a sell-off, thereby cooling off the recent hot streak.
NASDAQ:HOOD Has shown some financial fluctuations that are worth noting. Here's a detailed analysis based on the provided data:
Share Values:
- The Earnings Per Share (EPS) is at a negative value of $1.17, which indicates that the company is not currently profitable. This is, however, a significant improvement from the previous year when the EPS was -$4.38.
- The Book Value Per Share has slightly decreased from $8.44 to $7.79.
- Sales Per Share have decreased by 39.41% YoY, showing a drop in the company's sales revenue.
Profitability:
- Both the Return on Equity (ROE) and Return on Assets (ROA) are negative, indicating that NASDAQ:HOOD has not been successful in generating profits from its equity and assets.
- However, the Gross Profit Margin is high at 91.016%, showing that Robinhood has been able to retain a large proportion of its sales revenue after direct costs.
- The Operating Profit Margin and Net Profit Margin are both negative, indicating the company is not currently operating profitably.
Activity Ratios:
- The Total Asset Turnover is quite low at 0.05819, showing that Robinhood is not effectively using its assets to generate sales.
Financial Ratios:
- Robinhood doesn't have any long-term debt, which is a positive sign for its financial health.
- The Financial Leverage has increased, indicating that the company has been relying more on debt to finance its assets.
- The company has a quick ratio of 0.84975 and a current ratio of 1.41, both of which are indicators of short-term financial health. The ratios suggest that Robinhood should be able to cover its short-term liabilities with its short-term assets.
Valuation:
- The Price to Earnings (P/E) ratio is negative due to the company's negative earnings.
- The Price to Book (P/B) ratio is at 1.0447, which is relatively low and may indicate that the stock is undervalued.
Growth Rates:
- Revenue growth rate is currently negative at -25.185%, indicating that the company's revenue has been decreasing.
In summary, Robinhood is showing signs of financial struggle with negative profitability and a decline in sales per share. However, the company has a strong gross profit margin and no long-term debt. It is also important to note that the EPS has improved significantly, which may indicate a potential turnaround in profitability. Investors should carefully evaluate these factors and consider the company's future prospects before making an investment decision.
Risk Consideration:
While the recent uptrend might be enticing, it's essential to consider the inherent risk involved. Rapid price increases can sometimes precede sharp declines, particularly if the surge isn't backed by strong fundamental performance. As such, investors should be cautious and ensure their investment decision aligns with their risk tolerance and investment strategy.
Conclusion:
Given the recent run and the upcoming earnings, NASDAQ:HOOD presents a fascinating scenario for traders and investors. The forthcoming earnings report could be a pivotal event that either sustains the momentum or triggers a cool-down period. As always, investors should approach with caution and consider their risk tolerance and investment goals before taking a position.

$HOOD is at a nice entry point 📢Getting a strong bounce above $8.45 is a good indicator. I picked up today and now I just need to monitor for the price not to fall below the bottom support.

HOOD - DAILY BULLISH DIVERGENCE - BUY NOW?HOOD printed a DAILY BULLISH DIVERGENCE.
The price has created the first higher low since a long time.
245 % gains are likely if you are patient.
Once 19-20 $ is taken, the price will fly.
Take profit levels and final target are shown on the chart.
In my opinion , if it drops lower, may be worth to DCA into HOOD.

Hood potentials are not yet to be seen.I believe RobinHood have a lot of potential. They’re benefiting from high interest rate, the rise of bitcoin, the only broker with a Match IRA.
Potentials:
Pros
Advertisement of third party products, international expansion AI search integrated into the app.
Cons: may burn through all the cash and have to raise funds.
This is for educational purpose only

HOOD | Time To Buy AgainHOOD | Time To Buy Again
Robinhood Markets is close to a strong support area and the chances for the price to rise further are
growing even more.
I am looking at for the price to move down near $8 as the maximum this time.
However, the chances are very high that it can rise also from its current position.
Thank you and Good Luck!

HOOD - LongRobinhood Markets, Inc. is an American financial services company headquartered in Menlo Park, California, that facilitates commission-free trades of stocks, exchange-traded funds and cryptocurrencies as well as individual retirement accounts via a mobile app introduced in March 2015.
HOOD starts to make higher low. I am expecting a better price here.

ROBINHOOD Stock Chart Fibonacci Analysis 022023Trading Idea
1) Find a FIBO slingshot
2) Check FIBO 61.80% level
3) Entry Point > 10/61.80%
Positive outlook for Robinhood█ Robinhood is a true leader of the investing world holding the title of the first company to introduce the following services: commission free trading, trading free of flat rate fees, and fractional share trading. The main service that sets Robinhood apart from the rest of the blue chip stock brokerages on Wall Street is the fact it truly offers free stock option trading with zero commission and zero per contract flat rate fees, a feature no other brokerage offers (most charge a minimum $.65 per contract flat rate fee).
█ Lets take a look at the capacity Robinhood has to grow: they recently introduced IRA accounts that should provide folks with a more secure long term sense of responsibility as they appeal to Robinhood for business, but I believe Robinhood has yet to truly gain favor in the investing world because they still don't provide the service of short selling stocks/securities. As soon as Robinhood is able to increase the threshold of their margin capabilities to offer short selling accounts to experienced traders on Wall Street they will be given the approval they've desperately been waiting for; and even more exciting for tradingview users once Robinhood offers short selling their trading platform will be compatible to integrate into the Tradingview environment as another one of its featured brokers. In my opinion the outlook of offering a short selling service paired with the possibility of integrating its compatibility with Tradingview places Robinhood in the spotlight for all the right reasons (personally I'd love to trade on Robinhood right from my tradingview chart).
█ (Q) If Robinhood is really that great then why isn't it doing well already? (A) I believe one of the major downturns for Robinhood's profits was its promotional program that offered new users free stock that then coupled with the disastrous timing of Covid-19 to exponentially dole out an unanticipated amount of free products to new users due to the unprecedented increase in digital networking created by lockdowns and folks being homebound; all leading to a few terrible quarters.
█ (Q) How can Robinhood turn things around over night? (A) Obviously they have to stop their promotional give aways, offer short selling to appeal and compete with Wall Street professionals, and integrate with Tradingview as a featured broker. Now many people may underscore the importance of gaining the approval of trading professionals on Wall Street because Robinhood seems to target low capital investors from the rest of society but no one looks up to and respects the opinion of the pro's more than the fans sitting in the stand; meaning if the best traders on Wall Street give Robinhood a thumbs up approval everyone looking up to them for guidance will as well (that includes all the folks that have never traded or stepped foot in the world of finance before).
█ Technical Analysis: I haven't drawn much on the chart but it can get a little confusing.
I've labeled a few price points to keep in mind as Robinhood begins to turn into a raging bull, those are drawn in white and indicate typical values that profits are likely to be taken at.
A linear regression channel is used to highlight the current trend, I colored the top of the channel red to represent potential resistance values and the bottom of the channel green to represent potential support values.
The indicator below is provided to help support my thesis of bullish development as it's forming a bullish ascending triangle; and the signal/alert for a bullish ascending triangle is to simply anticipate the breakout as soon as resistance is broken. To be clear, as soon as the indicator breaks its resistance value and turns it into support the stock is expected to be in a bullish trend breaking out.
█ Thank you for reading, if you're looking for more on Robinhood there's plenty of material on the web that's readily available such as the forecast from Tipranks below:
www.tipranks.com

$HOOD On Track To ReboundRobinhood Markets, Inc. (NASDAQ: HOOD) has been making headway since its debut back in 2015 – offering retail investors the ability to make trades with no commissions and an easy-to-use trading platform. While HOOD rose to prominence during the stock market craze in 2021, the stock was greatly impacted by the steep decline of the stock market due to the Fed’s efforts to curb inflation. However, the HOOD stock forecast could be bullish for 2023 as the current stock market rebound has re-sparked retail investors’ interest in trading. With growing expectations of a dovish Fed pivot, the HOOD stock price prediction could offer substantial upside potential for investors.
HOOD Fundamentals
Adding New Products
Despite being impacted by the bear market in 2022, HOOD has been constantly working to improve its offerings as it continues to introduce new services. Last year, HOOD extended its equities trading hours as part of its long-term goal of providing 24-hour trading. In this way, HOOD could attract additional users this year as more investors could be interested in increasing their trades to capitalize on the current stock market growth. Moreover, HOOD launched Robinhood Retirement last December as the first and only IRA with a built-in match and no employer necessary. Based on this, HOOD could be poised to attract a large number of new users and an even wider pool of assets. Given the company’s constant innovation, the HOOD stock forecast could be bright for the future as markets rebound.
In addition to expanding its equities trading offerings, HOOD introduced additional services to allow its customers to gain passive income during the inflationary macro-environment. One of these services is its stock lending program which was launched in May 2022. This program allows HOOD’s customers to generate income by lending the stocks they’re holding. With this in mind, this program has shown significant growth potential as it reached nearly $15 million of annualized revenues in Q3 – with this number rising to $30 million by the end of January. Based on this promising growth, HOOD is actively working to improve this product to improve onboarding by making more equities available to lend and migrating to a new collateral agent.
At the same time, HOOD launched a revamped Robinhood Gold service offering its customers an industry-leading 4.15% interest rate during an inflationary macro-environment. Since the company is providing its customers with access to one of the easiest opportunities to earn yield in the US, Robinhood Gold subscribers increased in Q4 for the first time in more than a year. Moreover, Gold cash sweep balances grew to $6 billion at the end of January – highlighting the success of this launch. In light of the company’s impressive services, the HOOD stock forecast could be bullish for 2023.
Venturing Into Crypto
Although HOOD is known for its equities trading platform, the company expanded into the crypto space with the launch of its global crypto platform – the non-custodial Robinhood Wallet. Considering cryptocurrencies’ dip in 2022 following the rising interest rates, this product has not provided HOOD with the expected returns. However, the Robinhood Wallet could be on track to deliver significant revenues for the company this year thanks to the rebound cryptocurrencies’ are witnessing. With cryptocurrencies more appealing to investors in the meantime, the HOOD stock price prediction could show a significant upside as the crypto sector continues to witness high volume.
Global Expansion
While many companies are pulling back from new investments due to the macro uncertainty, HOOD plans to aggressively pursue additional long-term growth opportunities. With this in mind, HOOD intends to expand its services’ reach globally by introducing brokerage services in the UK by the end of 2023. In this way, HOOD could be on track to significantly grow its assets under custody and revenues as its services gain popularity in the UK market. Given the company’s constant efforts to grow its business, the HOOD stock forecast appears to be bright in 2023 and beyond.
Share Buyback & SBC Cancellation
Meanwhile, HOOD is seeking to add value to its shareholders as the company’s BOD recently approved a buyback of the 55 million shares purchased by Sam Bankman-Fried – founder of now-bankrupt crypto exchange FTX. These shares are owned by Emergent Fidelity Technologies – a holding company Bankman-Fried used to purchase these shares – which has recently filed for bankruptcy. On that note, there is an ongoing fight regarding the control of these shares between FTX’s debtors and BlockFi – a crypto lender that announced bankruptcy following FTX’s collapse. With these shares under the custody of the Justice Department, HOOD is in talks with the DOJ to buy back these shares. If the company successfully purchases these shares back, HOOD stock could soar given the scale of this share buyback.
Moreover, HOOD’s founders decided to cancel nearly $500 million of their combined share-based compensation. As a result, HOOD’s operating costs are expected to decline by up to $50 million per quarter starting in Q2 while also reducing HOOD’s fully diluted share count by 3.5%. Based on these cost savings, the company could be on the right track to reach profitability – making the HOOD stock forecast bright for 2023.
Risks
Despite HOOD’s growth potential and promising catalysts, the company has some risks that investors should note before investing. While HOOD is a leading brokerage among retail investors, the company has been constantly reporting declining Monthly Average Users (MAUs). In December, HOOD reported 11.4 million in MAUs compared to 12.5 million in November. On a YOY basis, this decline is significantly steeper as MAUs decreased from 17.4 million in December 2021. As a result of this decline in MAUs, assets under custody fell to $62 billion – declining 11% MOM and 37% YOY. However, the current market rebound could help boost MAUs and AUC as more investors are interested in trading.
Another risk HOOD faces is the SEC potentially limiting payment for order flow. On that note, payment for order flow is a key part of HOOD’s business model since it allows the brokerage to offer free trades to retail investors. Through payment for order flow, HOOD generates most of its revenues since it sells the stock orders it receives to market makers in exchange for a fee for directing the order flow their way. However, the SEC is proposing that instead of order flow being sent to a single market maker of choice, orders would be sent to auctions where a market maker offering the best price for a trade would win the bid. As a result, demand for order flow could take a significant hit if market makers determine it is no longer profitable for their business.
Another SEC proposal includes codifying brokers’ responsibility to get their customers the best possible price on trades. In this way, brokers would have to search extensively before selling order flows which could significantly impact brokers’ operating costs. Since the bulk of HOOD’s revenues is dependent on payment for order flow, the stock could drop if payment for order flow is limited by the SEC.
Since the SEC’s proposals would limit the company’s ability to generate revenues, HOOD has been working to diversify its revenue sources to limit the impact of these proposals. In 2022, transaction-based revenue – which includes payment for order flow revenue – represented 60% of HOOD’s total revenues compared to 77% in 2021. With the company improving its options trading offering and expanding into the crypto trading sphere, the HOOD stock forecast could be promising even if the SEC limits payment for order flow.
HOOD Financials
Looking into HOOD’s 2022 financials, the company grew its assets YOY to $23.3 billion from $19.7 billion. This increase is mainly attributed to $8.4 billion reported as assets related to user cryptocurrencies safeguarding obligations. HOOD’s cash balance also increased slightly from $6.2 billion to $6.3 billion. As for liabilities, HOOD reported $16.3 billion – increasing from $12.4 billion a year ago. However, $8.4 billion of HOOD’s liabilities are related to user cryptocurrencies safeguarding obligations.
In terms of revenues, HOOD reported $380 million in Q4 – representing a 5% YOY increase from $363 million. However, on a full-year basis, HOOD’s revenues declined 25% from $1.8 billion in 2021 to $1.3 billion. Meanwhile, HOOD successfully reduced its operating costs in 2022 to $2.3 billion compared to $3.4 billion a year ago. In this way, HOOD’s net loss declined from $3.6 billion to $1 billion in 2022. Given the company’s significant cost reductions, HOOD could be on the right track to profitability as it continues to expand its services and reduce its costs.
While HOOD’s financials could be underwhelming for many investors, it is worth noting that the company lost $57 million due to a processing error. This error caused HOOD to sell shares of Cosmos Health Inc. (NASDAQ: COSM) short into the market following COSM’s 1-for-25 reverse split. Despite detecting this error quickly, HOOD still lost a substantial amount of cash as it bought back these shares against a rapidly rising stock price.
Technical Analysis
HOOD stock price is currently at $9.92 and it shows supports near 9.07 and 7.71. The stock also shows resistances near 11.11, 12.96, and its 52-week high of 16.49. Considering the current rebound the stock market is witnessing, HOOD stock ran more than 22% on a YTD basis. As the current stock market run has re-ignited investors’ interest in trading equities, the HOOD stock price prediction could be bullish since the stock could continue climbing this year. Given the company’s plans to buy back Sam Bankman-Fried’s shares and expand its brokerage services in the UK this year, the HOOD stock forecast appears to be bright.
Despite HOOD’s impressive run to start the year, the stock appears to be losing momentum after recently dropping below its 50 MA. With the stock approaching a retest of its 200 MA, bullish investors could watch for this support to hold. If the stock holds its 200 MA support, this could be a bullish sign that another run could be imminent. However, HOOD could drop near $9 if it drops below the 200 MA support. In that case, adding shares near $9 could be a profitable investment for long-term investors given HOOD’s growth potential.
Considering HOOD’s long-term growth potential, accumulation is trending upwards which could indicate that investors believe the stock could be undervalued at its current PPS. The MACD also recently turned bullish which could signal a run in the near term. The RSI is picking up and recently climbed from 35 to 40 – indicating that HOOD could be slightly oversold. In light of these indicators, HOOD could be on track to run in the near term – especially if the company provides updates regarding the buyback of Sam Bankman-Fried’s shares. HOOD has an OS of 892.7 million and a float of 518.4 million.
HOOD Forecast
With the stock market rebounding off its 2022 lows, the HOOD stock forecast could be bright as more investors are attracted to trade stocks. Considering HOOD’s efforts to expand its equities trading offerings over the past year, the brokerage’s revenues could be poised to receive a boost from the renewed interest in trading. HOOD’s expansion into the crypto space by launching Robinhood Wallet could also provide the brokerage with a major revenue source this year given the crypto rally to begin the year. As the company is currently negotiating with the DOJ to buy back the 55 million shares owned by Sam Bankman-Fried, the HOOD stock price prediction presents a significant upside once the company successfully buys these shares back. Although the company is still operating at a loss, the HOOD stock forecast could be bullish since the company appears to be on the right track to profitability.

HOOD | Robinhood Markets - Bullish Harmonic PatternHOOD | Robinhood Markets - Bullish Harmonic Pattern
As we all have seen the stock market is suffering losses for a long
period of time and it is barely finding the bottom.
However, for many, this could be also a wonderful opportunity despite the
the fact that the price can stay in very low zones for a long period of time.
However, related to the economic perspective the U.S economy is very strong
and there is no reason for the stocks not to begin the recovery.
Yes, it is dangerous to buy now but not impossible.
In my opinion, HOOD is undervalued for the moment and the price reaction
at the Harmonic pattern, completion showed to be true.
After any small pullback HOOD could be a good buy opportunity.
Targets:
🎯 9.50
🎯 10.50
Thank you and Good Luck!

Finally, Robinhood has entered the software wallet sector. Wallet users can now view their owned NFTs and coins.
Robinhood Wallet was created to compete with MetaMask.
Robinhood has recently entered the software wallet market. The crypto business released the Robinhood Wallet, accompanied by smartphone software that allows users to exchange and send cryptocurrency. Furthermore, users may now view their own NFTs and crypto. Currently, over 1 million waitlisted consumers have access via an access code. Last year, the stock and cryptocurrency trading company Robinhood collaborated with Polygon to build the wallet, a self-custody, Web3 wallet. The trading platform only released a test version of its Web3 wallet for iOS. In May 2022, it was made available to the first 10,000 users who signed up for the waitlist. The wallet was first housed on the Polygon blockchain, allowing users to trade and switch cryptocurrencies while incurring no basic network fees. Johann Kerbrat, a chief technological officer of the Robinhood Crypto & Trading Platform, made the announcement public. Johann also revealed that Robinhood Wallet simplifies the complexity of Defi and web3 to make cryptocurrency more accessible to everyone. Polygon, as the preferred blockchain network for Robinhood, provides speed, scalability, scalability, cheap network costs, and a wealthy developer environment. Robinhood's partnership with Polygon began in August 2022, when the platform launched functionality for MATIC withdrawals and deposits on the proof-of-stake (PoS) chain.
The whole story of the Robinhood wallet release might be confusing because of the changes that took place in the last couple of months. Previously, the crypto platform introduced a new transfer feature on its original trading app as a “Crypto Wallet” product. The feature was launched in beta in January 2022, and it allowed Robinhood users to transfer crypto to and from the platform.
Technically, it wasn’t a crypto wallet as it’s almost the same as how users can transfer crypto to and from Kraken, Coinbase, Binance, or any other crypto trading platform. The wallet that is now officially rolled out today is considered more like Phantom, MetaMask, or the Coinbase Wallet.
The Robinhood wallet released now is a completely different product which is purposely housed in a separate standalone app to allow users to have maximum control over their crypto. The new app provides access to more advanced features, like NFT marketplaces and connecting to decentralized apps.

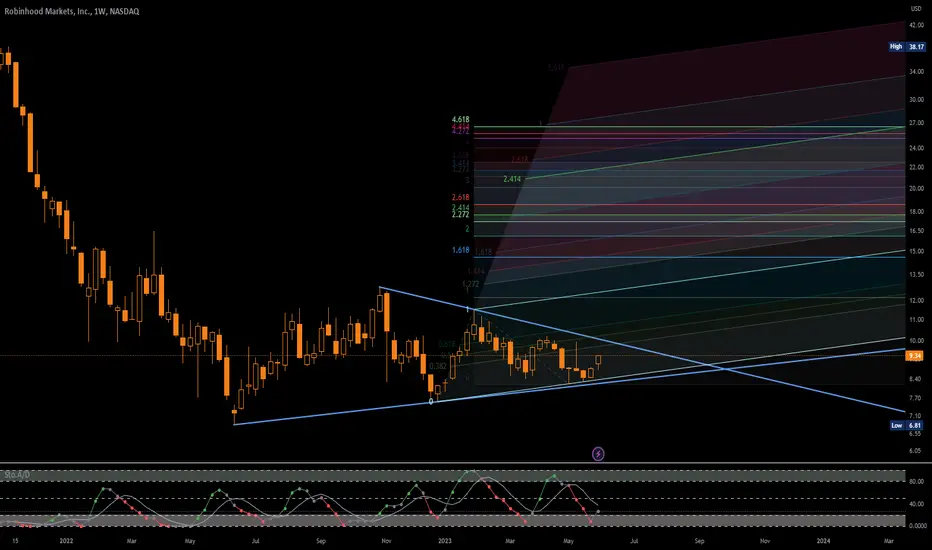
Robinhood HOOD 1W ChartToday you can review the technical analysis idea on a 1W linear scale chart for Robinhood Markets, Inc (HOOD).
Robinhood price has broken out of an ascending triangle and re-tested the resistance heading lower. Measured move could bring the price down to $6. It is a weekly chart so it may take some time to get there.
If you enjoy my ideas, feel free to like it and drop in a comment. I love reading your comments below.
Disclosure: This is just my opinion and not any type of financial advice. I enjoy charting and discussing technical analysis. Don't trade based on my advice. Do your own research! #millionaireeconomics

FTX's collapse raises concerns for crypto-related stocks Bahamas-based cryptocurrency exchange FTX's filing of Chapter 11 bankruptcy on Nov. 11 have sent stocks of financial services companies dealing digital assets tumbling, further reducing the already dented confidence for the cryptocurrency industry.
According to Bloomberg News-compiled data, the implosion of FTX, which at its peak was the third-largest cryptocurrency exchange, and its spillover effects have wiped out nearly $5 billion in value across a range of other companies.
FTX filed for bankruptcy less than 48 hours after a supposed rescue takeover from rival Binance. After news broke of the company's collapse, Binance CEO Changpeng Zhao warned of the potential negative impacts of the event on the cryptocurrency industry, saying, "a lot of consumer confidence is shaken, and I think basically it sets us back a few years."
Indeed, not long after the filing of bankruptcy, the event has taken a toll on the shares of financial services companies involved in the trading and management of digital assets.
The aftermath
Some of the apparent publicly-listed victims are Robinhood (NASDAQ: HOOD), MicroStrategy (NASDAQ: MSTR) and Galaxy Digital Holdings (TSX: GLXY), all of which have fallen at least 15% the week of FTX's bankruptcy filing. Another company affected was Silvergate Capital Corporation (NYSE: SI), which posted a record decline after news broke of FTX's collapse.
More than a week following the event, the price of Bitcoin dropped to $16,132, causing a decline in the stocks of Coinbase Global Inc. (NASDAQ: COIN) and other crypto-related listed companies.
Meanwhile, Cointelegraph's tracking of companies up to Nov. 17 showed that the event also affected institutional trading firm Genesis, blockchain financial services company Galaxy Digital, venture capital company Sequoia Capital, hedge fund Galois Capital, crypto lending firm BlockFi, exchange Crypto.com, investment firm Pantera Capital and crypto lender Nexo.
On Nov. 29, BlockFi also filed for bankruptcy, citing significant exposure to FTX.
Tougher regulations to follow
"With FTX going down, we will see cascading effects. Especially for those close to the FTX ecosystem, they will be negatively affected," warned Binance's Zhao.
He said the industry will likely face more regulatory scrutiny focusing on capital requirements and handling of deposits, which he thinks is "probably a good thing, to be honest."
In a research report, JPMorgan said the collapse of crypto exchange FTX and sister company Alameda Research would likely prompt the acceleration of crypto market regulatory initiatives already underway. JPMorgan expects the FTX bankruptcy to also elicit a greater sense of urgency for regulation in the US, which is something that may actually help crypto-related stocks avoid future FTX-like shocks.

Hood Buyout Incoming?Sam is gone, forced liquidated and hood made the right shoulder?
Don't think this stock is going to survive on its own, nor if their is going to be a buyout that is going to be higher than $20
Not investment advice, do your own due research.
Look First / Then Leap
Just speculating...

Robinhood: 3 Falling Methods Bear Flag BreakoutI wiull be buying puts of the 7 dollar strike that are a couple of months out and targeting a move towards the $1.27 level
