Identifying cyclical opportunities in $HOOD for optionsNASDAQ:HOOD has been in a bull trend since June of 2022, and its price action has also been decently straight forward.
Notes about NASDAQ:HOOD 's price action -
1. Hood's cycle lengths from low to low, in this daily chart are not uniform.
2. However the trends in between the swing lows and highs are secular.
3. Hood has been forming base lows instead of V pattern lows.
How I'm trading $HOOD.
- Since the trend is bullish it is best to stick with call options looking for confirmation of a cycle low to get long.
- When NASDAQ:HOOD starts to form a base after a cyclical downtrend look for momentum to enter
- Once identifying a swing high, exit calls and allow the next secular downtrend to play out
- Each cycle consider if the macro tend for NASDAQ:HOOD is still bullish
- Own NASDAQ:HOOD shares
** The timing band on this chart is a general area based off of previous cycles I'm expecting a base low and will be looking to get long.
HOOD trade ideas

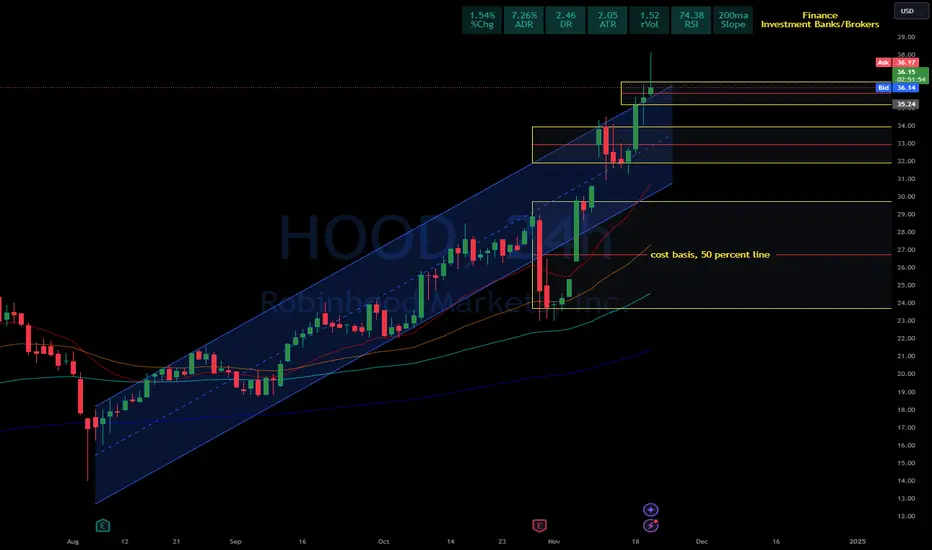
HOOD Robin hood markets 24hr potterboxes with a channel upHOOD Robin hood markets 24hr potterboxes with a channel up. Robin hood markets is in a clear uptrend as you can see. it needs to get past $38.14 mark. the next stop up could be $40.40 this just my interpretation of what could happen given all the data i have. The potterbox strategy, the laws of three and six come to mind. if you look closely you will see that hood is over the 50 percent line or cost basis. if hood opens on or above the 50 percent line it will continue up to $35.44 according to the potterbox strategy. lets watch and see tomorrow. when you go to lower time frames such as the 4hr you can see where the box touches. it is also at the starting of laws of three. just follow the patterns.
Hood pulling back creating a nice opportunityHood pullback is a gift, low 20s offer a good buying opportunity (first green horizontal already hit), i will buy more if it dips further. I am playing this for move to the high 30s.

$HOOD to 100%Technically, NASDAQ:HOOD is poised for a breakout, which could unlock 40%+ gains initially (+ potentially 60%+ later - but it's too soon to tell).
Catalysts: trendline support, above 50 SMA, crypto momentum, strong financials.
Watching for confirmation:
1. Breakout from the rising channel
2. Overcoming 15$ resistance

Hood demand zone on volatilityI love these demand zones for dip buys, you'll usually note that mostly wicks touch these but candle bodies closing within are usually great opportunities, or a sign that a longer time frame demand needs to be looked at. We see a very bottoming stochastic RSI here, and a completely loss of the 5 day EMA.
My plan:
Sell aggressive pivot point CSP here around 23/23.5$
I expect an aggressive move back to approach that daily GAP

Robinhood Dives Into Election Betting, Its Ambition Might be BigRobinhood has just launched election contracts, allowing users to trade on the outcome of the 2024 U.S. presidential election between Kamala Harris and Donald Trump.
The new contracts rolled out to a limited number of customers on October 28. Customers enable margin and options trading and need to be approved for a Robinhood Derivatives account.
With contracts set at $1.00 for correct predictions and $0.00 for incorrect, the payouts will be determined post-election certification in early 2025.
Contracts are available only for Yes positions, except that a No position can be placed to close out an existing Yes position. Customers may not simultaneously hold a Yes position for both candidates.
This launch follows recent regulatory developments, such as the D.C. Circuit's approval for Kalshi and Interactive Brokers to offer similar contracts.
While the CFTC voiced concerns about election integrity, the court permitted Kalshi to move forward, opening the door for Robinhood.
I don’t think Robinhood cares much about making money off Election contracts a week before the election — I think they are going for something much, much bigger…which is a marketplace to bet on anything, marking a potential shift beyond traditional stock and crypto markets.
In my view, this signals a strategic pivot for Robinhood toward a broader, all-encompassing platform where users may eventually wager on global events, similar to derivative markets.
Paired with recent rollouts like index options, futures, and a new trading platform, Robinhood’s rapid innovation rate is noteworthy.
Their agility demonstrates a keen ability to stay relevant in an evolving financial landscape, and if successful, this could redefine event-based trading.
Will this direction lead to a major expansion beyond traditional asset classes? Robinhood’s progress here will be intriguing to watch.
Robinhood is showing some impressive innovation here, and if this new product performs well, it could really boost the company’s diversification.
But back to the stock itself—after a 126% jump year-to-date, is now still a good time to buy?
Technically, In the long term, the current stock price is in an upward trend, but in the short term, the price has reached the upper edge of the bullish channel, making it susceptible to be rejected for a pullback. Furthermore, compared to the previous increases, the recent uptrend momentum has significantly weakened, further confirming the high risk of a short-term pullback.
Moreover, according to historical patterns, before each pullback in this uptrend, there tends to be a KDJ bearish divergence. The reemergence of this divergence currently suggests inadequate upward momentum, indicating that a short-term pullback in prices may occur at any time.
Therefore, although the Robinhood's presidential election contracts is highly favorable, from a rational perspective, it is advisable to entry after a short-term pullback.

$HOOD - I would not chaseNASDAQ:HOOD The head and shoulders (H&S) pattern was invalidated, and the stock has since run without me. 😤 It is currently in a frictionless area, meaning there is not much resistance in either direction for the stock.
If the stock were to play out a full Fibonacci extension, it could reach the $33.90 area. However, a pullback to the $24 to $22 area is certainly possible, which would check back at the price level where it broke out.
I will not be chasing the stock and will let it come down to the buy area noted on the chart. The Earnings Report (ER) is tomorrow, and it could create an opportunity for an entry. 👀

ROBINHOOD TO $70?! Let's break it down.NASDAQ:HOOD TO $70?! Let's break it down.
5 REASONS WHY:
1⃣ 4/5 ON THE "High Five Setup" trade strategy
2⃣ Strong fundamentals and AMAZING Sentiment
3⃣ The forming of a CUP N HANDLE pattern. Measure Move: $70
4⃣ Growth Beast! Newer generations are on board!
5⃣ Continue to grow their products and offer great deals for people to switch. Like the HOOD week, which had up to 3% match. They got me to move because the deal was too good to pass up!
Stay tuned for more!🔔
Like ❤️ Follow 🤳 Share 🔂
When does NASDAQ:HOOD get to $70 per share?! Drop a comment below.
Not financial advice.
#tradingstrategy #TradingTips

HOOD Robinhood Markets Options Ahead of EarningsIf you haven`t bough HOOD before the major breakout:
Now analyzing the options chain and the chart patterns of HOOD Robinhood Markets prior to the earnings report this week,
I would consider purchasing the 26usd strike price Calls with
an expiration date of 2024-11-1,
for a premium of approximately $2.00.
If these options prove to be profitable prior to the earnings release, I would sell at least half of them.

Hood bull flag into earningsHood is creating a weekly bull around a prior rejection zone, the stochastic RSI is heating up. As BTC continues bullish momentum I expect this stock to explode to 28$ in a few short weeks. I bet we see this target by the end of November at this rate. Hood seems like a better BTC proxy than miners lately as it actually has a company and revenue behind it and has nowhere near the amount of dilution.


HOOD LONGHOOD just broke out of its accumulation range, which is a strong indicator for the stock. This breakout suggests that investors have been accumulating shares, setting the stage for a potential rise toward the $25.50 mark.
In its latest earnings report, HOOD showed improved user growth and a reduction in losses, boosting investor confidence. With revenues up thanks to increased trading activity and the return of retail investors, there’s a lot of positive buzz around the stock.
The volume during this breakout has been solid, indicating more buyers are coming in, and it’s finding support on the low-volume node below, further reinforcing its upward momentum. If this trend continues, reaching $25.50 seems like a real possibility. Overall, it’s an exciting time for HOOD!

HOOD Swing Idea - short-termNASDAQ:HOOD is triggering the 5/10 ema cross on the daily and looks good in this spot here.
I'd like to see it get over the 50d SMA (20.63 currently) for added confirmation. If it opens above, I'll be buying at market open.
Using the daily ATR of .98, my exits are as follows:
SL: 19.26
TP1: Trim at 21.36 (some intraday supply here)
TP2: 22.83 start of supply zone
TP3: 23.69 only if showing signs of strength through supply, and only runner(s).
Max Date: Market Open of 9/24.
^^^If SL or TP levels have not been hit by max date, I'll exit at that time.
What I'm buying:
I like the Sept27, 20.5c's, currently 1.06, or a safer version is the Oct 20c at 1.86.
1hr chart showing small supply zone

HOOD: In the midst of a breakdown...I've been patiently waiting to buy HOOD, but never felt comfortable with the price point. I think I'll finally get my opportunity!...
We are potentially half-way through a corrective wave that typically follows an impulse move upward. September, historically, has been known to be a down month.
I've charted what looks to be a textbook example of some Elliot Wave patterns currently developing. Starting in late 2023, until mid July 2024, we had a nice bull run. It's possible we've begun a significant correction phase (ABC), based on what fundamentally follows a bullish impulse move up (12345).
The possible next move may have already begun ("C"), the final corrective move downward. Should it occur, we can expect to reach the potential target of ~$12-13.
$12 to $13 has shown to be an important price range in the past, when it had shifted from resistance to support back in the beginning of the bull run in the early 2024.
Confirmations of Corrective Wave (ABC):
Wave A : The initial drop from the peak of Wave 5 to the bottom of Wave A, showing a significant correction.
Wave B : A retracement upward from the bottom of Wave A, but it doesn't surpass the high of Wave 5, which is typical in a correction.
Wave C : (UNCONFIRMED) The final leg downward, which appears to be in progress.
Good luck all...

$HOOD - What if?NASDAQ:HOOD There’s a chance that a head-and-shoulders pattern could form, but it’s still very early, and it may not materialize. The right shoulder hasn’t formed yet, and the neckline support at $17 would need to break to validate the pattern.
With the way HOOD is executing, I don’t think this will materialize, but you never know. Technicals often front-run events that could validate the scenario they’re predicting. It’s always good to keep the possibility in mind and plan for what to do if it does.
I’ll be buying if HOOD actually trades down to the targets shown on the chart, as long as the fall isn’t due to fundamental issues.
As always, I share my opinions and trades. I’m not suggesting anyone follow my trades. You do you.

$HOOD over 50 daily ema is bullish 🚨 #YUSUKE_ALERT for NASDAQ:HOOD 📊
📈 Technical Analysis:
- Current price: $21.16
- Trading above 50 EMA (purple line)
- Recently bounced off support at $19.85 (PT1)
🔑 Key Levels:
PT1: $19.85 (Support)
PT2: $21.30 (Resistance)
PT3: $21.84 (Extended target)
March 2024 High: $23.40 (Major resistance)
👀 What to Watch:
- Bullish momentum above 50 EMA
- Potential breakout above $22.05 resistance
- Volume increase to support upward move
🎯 Possible Strategies:
1. Long calls targeting $22.72 or $23.44
2. Bull call spreads (e.g. 21/23 spread) for defined risk
3. Buy shares with stop loss below $19.85 support
⚠️ Risk Management:
- Set stop loss below $19.85 for long positions
- Take partial profits at $22.72 (PT2)
- Be cautious of resistance at March 2024 high ($23.40)
Remember, NASDAQ:HOOD can be volatile! Manage your position size carefully. 💼🧠
#Robinhood #FinTech #OptionsTrading #StockMarket #WallStreet #TradingAlert #InvestorInsights #MarketMovers #TechnicalAnalysis #FinancialMarkets #TradingStrategy #StocksToBuy #TradingLife #FinanceNews #TrendingStocks

HOOD bullish reversalHOOD bullish reversal trend starting soon. Expecting it to reclaim support at $24 within the next few weeks if macros align before resuming bullish trend towards $30 into EOY.

Hood to 24$ soonHood had a pump out of the wedge and then dump like many of these wedges do. A massive pivot has taken place and I took advantage of this by adding to my September calls in the 14$ range. I am starting to sell covered calls against my LEAPs as well. I would love to see the 24$ target as this would be a massive swing trade for me.
-I expect at least 22$ by the first week of Sept preferably 24-25$

Robinhood Stock Rises 2.51% After Record ReportKey Takeaways:
- Robinhood's ( NASDAQ:HOOD ) stock rose 2.51% following its impressive Q2 earnings report, showcasing record earnings and revenue.
- Earnings per share (EPS) increased to $0.21, surpassing expectations, while revenue soared 40% to a record $682 million.
- Significant growth in transaction-based revenue and assets under custody highlights Robinhood's expanding influence in the financial services industry.
Robinhood Markets Inc. ( NASDAQ:HOOD ), the mobile-first brokerage known for revolutionizing retail trading, saw its stock rise by 2.51% following the announcement of its record-breaking Q2 earnings. The report highlights Robinhood's continued growth as a dominant player in the financial services sector, despite ongoing challenges in the broader market.
Record Earnings and Revenue Surpass Expectations
Robinhood's second-quarter performance was a standout, with earnings per share (EPS) climbing to $0.21, an increase of $0.18 from the previous year. This figure easily surpassed analysts' expectations, which had forecasted $0.16 per share. Revenue, too, hit a new high of $682 million, marking a 40% year-over-year increase and exceeding the $640 million anticipated by FactSet.
One of the most impressive aspects of Robinhood's financial performance was the 69% surge in transaction-based revenue, which reached $327 million. This growth was driven by a 43% jump in options revenue and a staggering 161% increase in cryptocurrency revenue. Robinhood's net interest revenue also rose 22%, benefiting from higher securities lending activity and rising short-term interest rates.
User Growth and Asset Expansion
Robinhood's platform continues to attract new users and assets, albeit with some challenges. The company reported a 57% increase in assets under custody, which reached $139.7 billion. Monthly active users (MAUs) grew by 9% to 11.8 million, although this fell short of the 13.45 million predicted by FactSet. Despite the slight miss, the company's average revenue per user (ARPU) rose by 35% to $113, indicating increased engagement and monetization of its user base.
The Robinhood Gold premium subscription service also saw significant growth, with subscribers increasing by 61% to 2 million. This rise reflects the company's success in upselling more advanced trading tools and services to its users, further enhancing its revenue streams.
Net deposits hit a record $13.2 billion, with an impressive annualized growth rate of 41%, showcasing the trust and confidence retail investors continue to place in the platform.
Challenges and Opportunities:
While Robinhood's Q2 performance was impressive, the company faces challenges, particularly in its stock price movement and upcoming ventures. The stock has been in a steep downtrend since mid-July, despite being up 34% for the year through Wednesday. The shares are currently testing support at their 200-day moving average, a critical technical level that could determine their short-term direction.
Looking ahead, Robinhood's entry into futures trading represents a significant opportunity and a potential risk. The company has not yet disclosed its fee structure for futures trading, but the higher costs associated with executing these complex financial products could lead to the introduction of fees. This move might be met with caution by Robinhood’s user base, which has grown accustomed to commission-free trading. J.P. Morgan analysts have suggested that this development could be pivotal in Robinhood's evolution into a full-fledged financial services provider.
Conclusion
Robinhood's strong Q2 results and expanding service offerings is a testament to its growing influence in the financial industry. The company's ability to consistently exceed expectations, both in terms of earnings and revenue, speaks to its robust business model and its appeal to a wide range of retail investors. However, as Robinhood continues to innovate and introduce new products, it must carefully navigate the challenges that come with growth, including maintaining user trust and managing costs. The future looks promising for Robinhood, but the path forward will require strategic planning and execution to sustain its momentum in a competitive market.

$HOOD Head and Shoulders topping pattern after earningsHas a gap to fill quite far down but bears look hungry to take this one down after a great run so far in 2024

What’s under the $HOODFeel bad not buying at $10 what an easy 100%
Stock trading platform for retail investors adding features. Ran hard at IPO, and has now moved up tot eh next fib level and is trying to break through.
Strong consolidation under fib. Looking for a jump at earning.
Target price is hard here. It hasn’t spent much time above $20…… is it possibly it eventually heads back to all time highs in a year? I don’t see why it couldn’t.
I’m looking for the trading platform that incorporates AI suggestions. It won’t be E*trade as E*Trade is garbage.
This is looking like a long. It’s in a great regression channel too….. I like this one.
Not trade advice

Hood wedge updateOnce again, the wedges I track tend to explode outside of the wedge, pump for 2-5 days, then give almost the entire pump back to the market. My plan was a mixture of swing trading and option selling.
-I locked in my August trade for about 50% total
-My September calls remain intact which have a safer strike price for volatility reduction
-I plan to keep my LEAPS and continue to sell safer covered calls against them.
-I think we bounce off 22.3$

40% Increase on the horizonLets keep it simple. We flipped the VAH into support and continue to build value above, next area to test is the VAL above 40% higher. A nice pump is incoming and keep in mind, if the crypto market is bullish so is Robinhood.
Stay focused.
Calculate Your Risk/Reward so you don't lose more than 1% of your account per trade.
Every day the charts provide new information. You have to adjust or get REKT.
Love it or hate it, hit that thumbs up and share your thoughts below!
This is not financial advice. This is for educational purposes only.
