HOOD trade ideas

5/8/24 - $hood - not much juice left into this print, caution5/8/24 - vrockstar - look guys i think the UX rocks, the 3% IRA carrot was genius and overall... this "is" a better way to do banking/ crypto/ trading. not going to short the stock, but a lot of this positive stuff is defn incorporated since last EPS where the stock ran nearly 100% and it's realistically "just" off it's highs. even if we assume 50c of EPS power, it's not growing 100% yoy so you're paying over 30x PE for this? Not my cup of tea. Where I struggle is that any less than stellar result in this tape are getting absolutely rekt and any beats are seeing retraces at the open, so at this valuation you need an absolutely SMASHING result and once again, the stock somewhat prices this in. I tend to think the risk reward is probably skewed more negatively here, so wanted to post a note for my own reference. i'd be a buyer back near that gap fill in the $12s. If we do see a pop on "good" but not "stellar" results - would be a good oppty to resize your risk here IMO, or sell some C's for IV.


HOOD need more volume to see any upside momemtHood may see 17.35 before it makes any further moment, this can happen either today or tomorrow after earnings very much careful it may be dumped like may others due to ongoing news.

SEC issues Robinhood Crypto with Wells NoticeRobinhood ( NASDAQ:HOOD ) Markets has received a Wells Notice from the U.S. Securities and Exchange Commission (SEC) citing alleged securities violations. The crypto unit of Robinhood Markets, Robinhood Crypto, received the notice on May 4. The SEC staff has made a preliminary determination to recommend an enforcement action against Robinhood Crypto, alleging securities violations. Robinhood Markets, Inc., ( NASDAQ:HOOD ) Chief Legal, Compliance and Corporate Affairs Officer, Dan Gallagher, expressed disappointment that the agency has decided to issue a Wells Notice related to their U.S. crypto business.
Last year, Robinhood ( NASDAQ:HOOD ) Markets said it had received an investigative subpoena from the SEC related to listings of cryptocurrencies. The SEC has previously targeted decentralized crypto exchanges like Uniswap and Coinbase, and Ethereum development studio Consensys. Consensys later moved to sue the SEC, arguing that regulating ether as a security would jeopardize the U.S.'s ability to use Ethereum and other blockchains. The implications of regulating ether as a security would extend beyond digital asset trading, jeopardizing the future of innovations, products, and U.S. jobs that the next generation of the Internet will unleash.


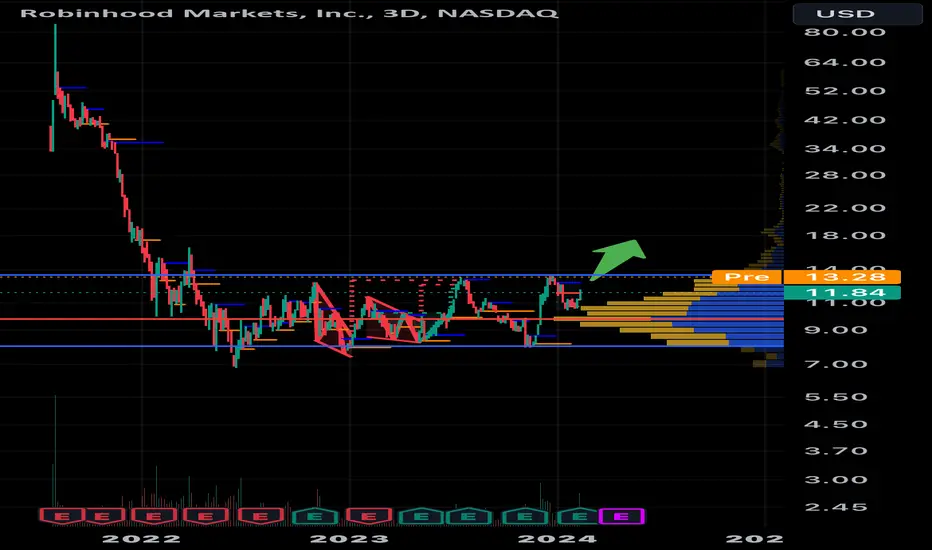
Robinhood BearishNASDAQ:HOOD Seems to have reached a local top and is due for a retest of the lower fin levels before picking upwards again. Expecting the stock to fall to 14$ (0.382) in the next 1 to 2 weeks.
RSI Divergence on the daily chart + overbought.
Potential downwards mouvement to MA line on 0.5 fib

📈🚀 Robinhood (HOOD) Growth Analysis 📊💰User Growth Momentum:
NASDAQ:HOOD demonstrates impressive user growth driven by strategic promotions and incentives, solidifying its position with 23.6 million funded accounts as of February.
Institutional Investor Appeal:
Initiatives like the 3% match on IRA contributions attract institutional investors, boosting assets under custody to $118.7 billion.
Revenue Diversification:
Subscription revenue, particularly from Gold membership, saw a 25% increase in Q4 and is expected to rise further with continued advertising and promotions.
Trade Projection:
Bullish stance above $14.50-$15.00.
Upside target of $28.00-$30.00 reflects potential growth and value appreciation as Robinhood expands its user base and revenue streams.
📈💡 Stay tuned for HOOD's growth trajectory! #Robinhood #FinancialIndustry 🚀📊

HOOD EARNINGS CHART, THE LITTLE FEATHER THAT COULDHood potential earnings chart.
I labeled the important stuff within the chart.
There is a big trend line that I don't think will hit because it takes price down to $3, which I guess is theoretically possible.
I think 8.45 is a more real price and if that price hits, it seems the price can get up to $13.
It can also go the other way, upside first to $13.
I drew a small guideline for a potential path, but there are many, focus on the price targets and trends.
And again, 8.45 is a really strong price support target.
Good luck.

Where my hood at part 2First idea was a banger, i like Hood a lot, i will like it a lot more when it test sport at the $15 level (green horizontal). This is timing up nicely with TD sequential as well.

HOOD Short: Peak reachedI just watched "Dumb Money" and I thought to look at Robinhood's chart. What I found tells me that Robinhood will probably not see above $20.55 for a long time to come. Avoid this stock.

HOOD: From Accumulation to Breakout? HOOD's chart shows an interesting development with a potential move out of a Wyckoff reaccumulation range. This follows the recent earnings surprise, which positively impacted the stock price. However, remember that the stock market is volatile and reaching new highs is not guaranteed.
Robinhood long I would be a bit weary of going long right now on robinhood as the market across several time frames (daily, 240 minute, weekly, etc) is extended. However, if Robinhood does continue for another leg higher it needs to start to hold the pictured zone right about now. Other wise the stock may need a deeper pullback into that deeper zone as shown below.

Still trending upward?Trading at 19.59 now. Weekly RSI at 82, but hourly RSI at 32. It seems like an entry point on the hourly charts, but an exit point on the weekly charts. As a momentum trader, this is where I usually get stuck. Seems like an uptrend, but volume is decreasing... Anyone have any thoughts on this? Is there any more upside to this trade?

HOOD post earnings continuation LONGHOOD reversed from a triple bottom at earnings and has been uptrending since then.
Fundamentally accounts and money inflow has increased. HOOD now has a credit card with
3% cash back. Low commissions, options, IPOs IRAs are all part of HOOD's services.
The Price Momentum Oscillator and Relative Trend Index indicator both support a bullish bias.
I will take a long position here at the beginning of another quarter while rate cuts may
trading and HOOD's current trend. The trend is forecasted to continue. I see a Doji candle
as suitable for the long entry.

Where my Hood atHood needs to close the week above 12.95 to make a new swing high, if this fails then i believe the swing low will need to be tested at 10.65. Above 12.95 things start to get exciting, as i don't see 13.58 acting as much resistance.

Bullish on HOODHOOD had solid earnings, and broke a key trend on the weekly. This looks EXTREMELY bullish!
Not financial advice, good luck to all :)

HOOD SEEMS PRETTY BULLISH BUT NEEDS TO MAKE A HL Hood looks bearish short term in order to make higher low to strengthen the uptrend.

Robinhood Stock Surge Amidst New Credit Card LaunchRobinhood Markets Inc., ( NASDAQ:HOOD ) the disruptive force behind commission-free trading, is poised to revolutionize the financial landscape once again with the introduction of its Robinhood Gold Card. This groundbreaking venture marks Robinhood's expansion beyond its traditional brokerage services into the realm of financial services, positioning itself as a comprehensive financial platform for the modern consumer.
The Robinhood Gold Card, exclusively available to members of the firm's subscription-based Gold program, is set to redefine the credit card experience. Offering unparalleled benefits with no annual fees or foreign transaction charges, the card boasts an impressive 3% cashback on all categories of purchases. This generous rewards structure eclipses competitors like JPMorgan Chase & Co.'s Chase Sapphire Reserve, which limit similar rewards to select transactions.
Robinhood's CEO, Vlad Tenev, expressed ambitious aspirations for the Gold Card, stating, "Our goal is to enter this market in a big way." Tenev emphasized the company's commitment not merely to introduce a credit card, but to pioneer a product that sets industry standards and propels financial innovation forward.
Market response to Robinhood's ( NASDAQ:HOOD ) announcement has been overwhelmingly positive, with the company's shares skyrocketing by 6.9% to $20.61 in early trading following the news. This surge builds upon an already impressive trajectory, with Robinhood's stock rising by 51% through the close of trading on Tuesday, far outpacing the broader market.
However, the Gold Card launch represents only one facet of Robinhood's strategic evolution. The company has been steadily diversifying its offerings, transcending its origins as a retail brokerage service. Last year, Robinhood unveiled a retirement product, signaling its commitment to long-term financial planning. The response has been remarkable, with over 500,000 Robinhood retirement accounts opened by the end of last year, boasting deposits totaling $1.7 billion. This figure has since surged to over $3 billion by February, underscoring the growing trust and engagement of Robinhood's customer base.
Central to Robinhood's expansion into the credit card space is its acquisition of credit card issuer X1 Inc. for approximately $95 million. With co-founder Deepak Rao assuming the role of general manager of credit cards for Robinhood, the company is well-positioned to navigate the complexities of the credit card industry and drive the Gold Card rollout to new heights.
The introduction of the Robinhood Gold Card marks a pivotal moment in the company's trajectory, solidifying its transition from a trading app to a financial powerhouse. By offering innovative financial products with customer-centric features, Robinhood is redefining the way consumers engage with their finances, setting the stage for a new era of financial empowerment and accessibility.
Technical Outlook
Robinhood stock ( NASDAQ:HOOD ) is trading above the 200-day Moving Average with a positive Relative Strength Index (RSI) of 69.70 indicating further price breakthrough.
In an increasingly competitive landscape, Robinhood's bold vision and relentless pursuit of innovation are reshaping the future of finance, empowering individuals to take control of their financial destinies like never before. As the Gold Card rollout gains momentum, Robinhood's journey toward becoming a holistic financial platform is poised to revolutionize the industry and redefine the expectations of modern consumers.

$HOOD FINDS FOOTING AMIDST BULL MARKET$HOOD:1D
Long-term Fib Retrace from ATH.
Short-term Fib Extension from January 2024 lows.
Top indicator = Relative Strength Index (RSI)
Middle indicator = On Balance Volume (OBV Oscillator)
Bottom indicator = Directional Movement Index (DMI)
VWAP from highest high (yellow)
After coming out of a protracted, multi-year basing (blue), upside price momentum looks to be waning with bearish price to RSI divergence (violet) forming on the 1D time frame.
NASDAQ:HOOD volume flows as measured by on-balance-volume (OBVOSC_LB, middle indicator) are extremely constructive and posting historically high levels from price inception at initial IPO.
Given the strength of the bullish trend as measured by the directional movement index (DMI, bottom indicator) price is well cushioned to withstand a pullback and remain positively trending.
EWT counts are speculative and intended as a theoretical guide rather than an absolute path. The 3rd wave up could have the momentum to reach the 1.382(22.51) before meeting an increased potential for pullback into the 4th wave. The VWAP from ATH (yellow) is roughly in confluence with the 0.786 (15.81) and provides an impulsive shelf of support for a retrace as long as price were to consolidate above these respective levels.
The next level of downside support would be the 0.5(13.57) price level and while a breach of this particular level would not invalidate the count by dipping below 2 (10.38) it would invalidate my thesis and close the trade.
Upside price target for a 5th wave would be a 23% move to the upside with consolidation above the longterm Fib level of 0.786 (23.54) by end of July 2024. The secondary, 'reach target' sits 41% percent above current levels at the short-term 1.786 (27.00) Fib level. I would like to see this 1.786 (27.00) level taken out before end of November, 2024.
NOT FINANCIAL ADVICE.

How to trade HOODHOOD, now at 16.8 on Mar-19-2024 :
Wait and buy few at 15.9, 14.85, 13.85
Should be able to hold 6 to 8 months
Price levels to watch on upside --> 19.2, 21.26, 22.53, 23.56, 24.6
Expected gains from current price ---> 47%

Robinhood Stock Skyrockets as EU Wing Embraces USDC ListingRobinhood's ( NASDAQ:HOOD ) Europe division has announced the listing of USD Coin ( CRYPTOCAP:USDC ) on its platform, triggering a surge of excitement among investors and traders alike. As the Robinhood ( NASDAQ:HOOD ) stock soared by 12% in pre-market trading, the stage is set for a groundbreaking expansion in the company's offerings and user engagement strategies.
Robinhood's decision to embrace USDC, a stablecoin pegged to the US dollar, underscores its commitment to democratizing access to digital assets and fostering financial inclusion. With over 25 cryptocurrencies now available on its platform, Robinhood ( NASDAQ:HOOD ) is poised to capture a broader segment of the market and cater to the diverse needs of its global user base.
The listing of USDC on Robinhood's European platform represents a significant milestone for the company, marking its continued expansion into new territories and product offerings. By providing users with the opportunity to earn rewards of up to 10% on their USDC holdings, Robinhood ( NASDAQ:HOOD ) is incentivizing participation and driving engagement in the burgeoning crypto ecosystem.
The reward program, slated to run from March 1 to June 15, offers users the chance to earn incentives by simply holding USDC and trading any supported crypto on the platform. With a maximum payout of €1,000 ($1,094) in USDC during the promotional period, participants have a compelling reason to actively engage with Robinhood's crypto offerings.
Furthermore, Robinhood's USDC Learn and Earn campaign aims to educate users about the fundamentals of cryptocurrency while rewarding them with €5 of USDC. By encouraging users to explore the "Learn about crypto" section on their crypto home tab, Robinhood is empowering individuals to enhance their crypto knowledge and make informed investment decisions.
The announcement of these innovative initiatives has not only fueled a surge in the price of Robinhood ( NASDAQ:HOOD ) stock but also generated renewed optimism among investors. With the HOOD stock price surpassing $19 in pre-market trading, Robinhood ( NASDAQ:HOOD ) is poised to reach new heights and solidify its position as a leading player in the fintech space.
Moreover, the recent rally in Robinhood ( NASDAQ:HOOD ) stock has helped the company recover from earlier losses, signaling resilience and strength in the face of market volatility. As investors eagerly await further developments, one thing is clear: Robinhood's embrace of USDC and its innovative reward programs are set to reshape the landscape of digital finance and drive sustained growth in the months ahead.
Technical Outlook
NASDAQ:HOOD is currently in a bullish trend trading above the 200-day Moving Average with a positive Relative Strength Index (RSI) of 77 indicating bullish momentum.

$HOOD Expansion PathsIt's a bit unclear, but NASDAQ:HOOD is almost certain to follow the CRYPTOCAP:BTC performance trend (either direction).
If CRYPTOCAP:BTC continues to $100K+, expect NASDAQ:HOOD to push back toward previous ATH range ($48-$70) this year.
