IBM further correction ahead?IBM, right now in a "Minute"-wave c (blue) , is about or has finished a "Minuette"-wave 2,c in a rising pennant! Trade carefully, a bulltrap above red resistance line is still possible. - First target could be blue support line.
IBM trade ideas

IBM 2 hr - detail of previous chart setupAs noted in previous IBM daily chart.
Trade setup only if price declines into the buy zone at 157, near Ichi cloud base and .50 retracement.

IBM, eyeing small pullback for long entryEMA 13/48 cross took place yesterday. Waiting for small pullback for a better long entry. Price is finally more coiled up after larger chaotic movement.
Price resisted at the confluence of the A) natural 1.27 extension of the Feb 27 to Mar 02 swing, B) Jan 17 to Feb 19 .618 retracement.
Looking for 157-158 entry, profit target 162-164.

IBM next dip?IBM in a final "Minuette"-wave 5 (red), "Minute"-wave c (blue) of a "Minor"-wave 2. First target $142 (1:1 with wave 1 (red). Could go down further (Test of blue support-line)...

IBM support LongIf the s/r band and the trend line hold, it should be a good long
ENTRY: Anywhere in yellow s/r band
STOP: Below 143ish
2r target: 158ish

IBM Going to Test Key S/RWatch for bullish candle to close above key resistance long-term support at $154 to go long, which coincidentally intersects 200 MA. Big news coming with blockchain technology.


IBM INVERSE HEAD & SHOULDER PATTERNHERE'S A NICE SETUP OF AN INVERSE HEAD & SHOULDER PATTERN ON THE WEEKLY CHART

Bearish Deep CrabIBM, create other cancels other order for target/stop, it may move upwards to fill that gap right above it before heading down again but lets see what happens, still learning.
Target: 159.00
Stop: 164.50
Time Frame: Feb 12th

Bullish 'head and shoulders' (Ithink...)NYSE:IBM has been talked about on some of the main propaganda channels lately so I'm hoping there will be lots of momentum. If successful, it might actually eventuate before the end of Q1.

Warren Buffett is out - This idea is adapted.That was a mistake of the “Legend”, Warren Buffett, to sell parts of his former stake at the company. I secure the profit in this idea.
Newsflow:
International Business Machines Corporation IBM and Denmark-based transport and logistics conglomerate A.P. Moller – Maersk will create a joint venture using blockchain technology to make global trade more efficient, transparent and secure.
IBM and Maersk started cooperation in June 2016 in order to test new blockchain technologies. Since then, several large companies, such as DuPont, Dow Chemical, Tetra Pak, Port Houston, and government bodies including customs regulators in the U.S. and the Netherlands have already used the pilot platform from IBM and Maersk.
Currently, the numbers of IBM are also in the center! Here we go!
On January 18, 2018 IBM announced fourth-quarter and full-year 2017 earnings results.
The American International Business Machines Corporation (IBM), the world's largest provider of computer services, for the first time in 22 quarters increased its revenue in the fourth quarter of 2017. However, according to IBM 2017 fourth-quarter and full year results the the company had a net loss due to a one-time charge of $5.5 billion associated with the enactment of U.S. tax reform.
Fourth-quarter revenue increased by approximately 4% - from $21.7 billion to $22.5 billion. The last time IBM recorded revenue growth in annual terms in the first quarter of 2012.
IBM announces more than 30 percent revenue growth in the cloud segment in the last quarter. Last year, the Group converted 17 billion with the cloud, 5.5 billion of them in the last quarter of the year alone.
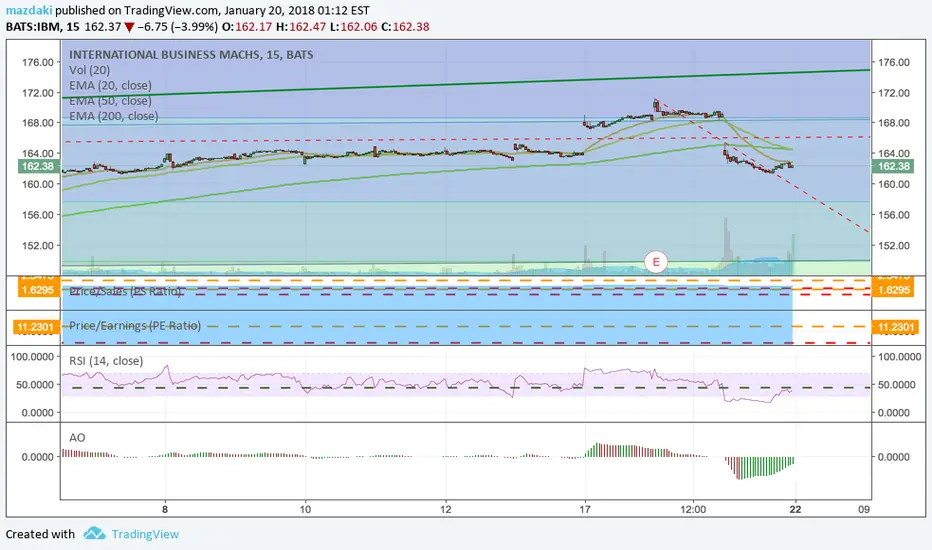
IBM’s stock price is about 162.37 US-Dollar a share.
Chart Tools:
Oscillator: The level of RSI is around 66 and was currently falling back from the overbought zone. The upward movement of the RSI showed a strong price increase. This correction was overdue.
Trend indicator: The MACD from IBM rose dramatically, remains positive, but here too, a short-term countermovement could be imminent.
The risk management tool used here is the own-developed “Traffic Signals System” (TSS) and it is implemented in my analyses.
The black line in the chart: the starting price of the idea is 151.82 US-Dollar.
The yellow line in the chart: indicates the achievement of the first target and thus the achievement of a possible turning point at about 162 US-Dollar.
The red line in the chart: the stop loss is 156 US-Dollar. Here is adapted. For the first time in this idea, the profit is hedged at 2.75 percent from the start of the idea.
The green line in the chart: here for me a further turning point in the idea = next goal at about 171 US-Dollar and this was reached on January 18, 2018.
CONCLUSION:
The joint venture will now allow IBM and Maersk to scale their solutions to a broader group of global corporations. Already today a lot of them have shown the interest in opportunities and are exploring the ways to use new platform, including: General Motors and Procter & Gamble.
The revenue’s growth in the cloud segments is also positive and could mean a bright future for IBM.
How is this journey going? With the adjustment of this position trading idea, the ideas is hedged with +2,75 percent considered from the start of this idea. In the short term take profit could therefore lead to lower prices.
Disclosure:
"The trading ideas published here are neither to be understood as a recommendation nor as an offer or an invitation to buy or sell financial instruments and should not be understood as such.
You must also assume that the author holds the recommended position in his portfolio and benefits from the implementation of his trading ideas.”

Quarterly earnings were not enough?IBM ended a long period of decline, however it seems that an attempt to change the trend was quickly rejected.
Despite having delivered higher-than-expected earnings reports, the price is close to a very important level of support.
What makes me wonder...
would it be possible that this attempt to change the trend was initiated by the expectation generated by the income report?
And after not having covered the "expectations" immediately lost attention?
If that is the case, we will most likely see its price stay within the channel that respect good part of the 2017.
If it's just a break, we'll see IBM succeed and rise after retesting this support point.
Whatever the case, there are enough reference points to make decisions.
I hope this is useful for you.
Best wishes to all.

IBM still a buy If you missed the previous run up, here is your second chance to take a bite out of the apple. I'm doubling down... This is a great opportunity to add on to the position
Buying IBM call optionsI'm considering buying two IBM call options with a strike price of $160 and expiration of 1/18/2019.
I think price will raise to my first and possibly second target. The plan is to sell one contract at T1 and then wait to see if T2 is realistic. If so I'll wait for T2 to sell.
T1= $180
T2= $215
What do you think? Will my targets be reached within the year?

Bearish Island Top Forms in IBM SharesA rare but very bearish Island Top has formed in IBM shares today. Earlier in the week, the shares gapped up through $65 higher, traded at new highs for two days in the $168-$172 range then gapped back down under $165 today. This combination of an exhaustion gap upward and a breakaway gap downward indicates a major top has formed for the shares. It also means that anyone who bought Wednesday or Thursday is now offside and underwater, a potential source of selling pressure. Initial downside support could appear near $161.68 or $158.75, 38% and 50% retracements of the recent uptrend.

Earning play pt 2IBM has gapped up since yesterdays open. Looking at prior earning reports the stock does provide us with the volatility we need to profit off this earning. The RVI is backing this idea with the breakout in the trend. However, the RSI is showing this stock could potentially be overbought and a short-term sell off could occur. Also, the 50 MA is providing the support for the stock. Potentially, a short and long hedge could be played here.


THE WEEK AHEAD: IBM, SLB, KMI EARNINGS; XLU, SMH, IYR, EWW, VXXEARNINGS
The earnings on tap aren't looking very enticing to me, as I generally look at getting in on these where the implied volatility rank is >70% and the background implied volatility is >50%. However, they might be worth watching running into earnings to see if implied ramps up.
KMI (implied volatility rank 79/implied volatility 30) announces earnings on the 17th after market close. The January 19th expiry's implied volatility is at 40%, with the 26th's at 31.4% (a 27.5% potential contraction). Given the underlying's price, it's probably best to go short straddle. Unfortunately, the Jan 19th's 19.5 short straddle isn't paying much -- .70 at the mid, with break evens clear of the expected move. Given what that's paying, a defined risk play won't pay.
IBM (implied volatility rank 93/implied volatility 26) announces on the 18th after market close. January 19th's implied's at 43.2; the 26th's at 31.3 (38.0% potential contraction). The January 19th 157.5/170 short strangle (23 delta) is paying 2.30 at the mid; the 152.5/157.5/170/175 iron condor's only paying 1.49 (<1/3rd wing width), so would probably pass on a defined unless implied volatility frisks up running into earnings.
SLB (rank 100/implied 27) announces on the 19th before market open. January 19th's implied is 35.4 vs. Jan 26th's of 27.9 (26.9% potential contraction). The 19th's 76/80 short strangle's paying 1.07 at the mid. Defined -- not worth it.
NON-EARNINGS
Another area in which implied volatility rank makes potential plays look promising, but where background implied volatility isn't up to stuff. Currently, there are no exchange-traded funds whose implied volatility rank is in the upper one-quarter of so of where it's been over the past year and where background implied is greater than 35%.
For what it's worth, though, here are the top ones: XLU (73/15), SMH (59/23), IYR (57/14), and EWW (51/24).
VOLATILITY PRODUCTS
Recently I've been working VXX* in two ways: (1) "price agnostic," where I enter either a long put vertical or short call vertical when the next weekly expiry open on Thursday or Friday; and (2) on pops where the VXST/VIX ratio is >1.0 (the higher the better). Unfortunately, it's tough to forecast a pop (although I've seen people repeatedly make the attempt), so you just have to set up an alert to trigger on a VXST/VIX ratio print of >1.00 or a VVIX print of >110 and keep powder dry for when it happens.
* -- I've been waiting for UVXY to reverse split on the notion that a 1/2 strike of movement in an 8.67 (UVXY Friday close price) underlying is somewhat more of a heavy lift than a 1/2 strike of movement in a 25.85 one, even though UVXY is leveraged.


Good pattern on IBM before the announcement of resultsIBM will announce its Q4 results this 18-jan. What is interesting is the current "cup and handle" pattern on the stock. The figure is 260 days length and 16% height. In addition, there is still a GAP of march 2017 that haven't been fulfilled. From there 2 scenarios are possible:
1) The results are not exceptional and IBM pullback on the green support of the figure and the bullish trend take longer to start (blue scenario)
2) The results are excellent, there is no pullback, the Gap is filled and then the stock jump to the resistance of 180$ (red scenario)
The good news is that both scenarios are bullish and algorithms confirms these predictions at 91%.

IBM Meeting Heavy ResistanceIBM has been one of the worst DOW stocks of 2017, but things might change going ahead. IBM which should be seeing a bottoming in revenues as they return to growth from data analytic initiatives and a upgrade cycle in mainframes is on the verge of breaking out. Currently, IBM sits at a major resistance line. Watch for a breakout which could see the stock retest all time highs around $181.00, but a failed breakout may retest rising support around $155.00.

