IBM going on a MOON MISSIONIBM looks really good for the long term.
Against everyones expectations the stock market is going to boom.
IBM trade ideas

Rushing ThroughNow we managed to fall below the classical pivot. Usually it would look like if we have sufficiently corrected the October-mid December rise. But as here is not only the pivot but a twice confirmed former resistance point it is as much important that we may even see a much deeper corrective decline to the direction of the 78 % Fibonacci level as a magnet. Whether it will really fall as deep is not clear of course. There are some obstacles to overcome on this way and everything will depend of the development of the momentum in the weeks ahead.
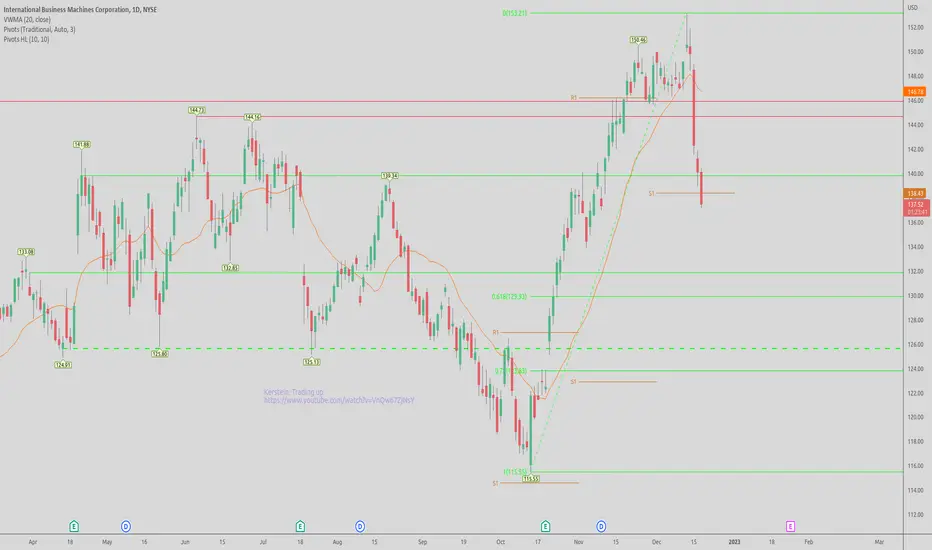
PivotWe are stopping the fall at a triple support: the April and August high, the Pivot(floor traders' calculation) and the 38 % retracement of the rise since 13th October. In my opinion this is good for an upward correction ahead of the year end, the more that the IBM share may be considered as a must have for window dressers due to the impressive rise this year.

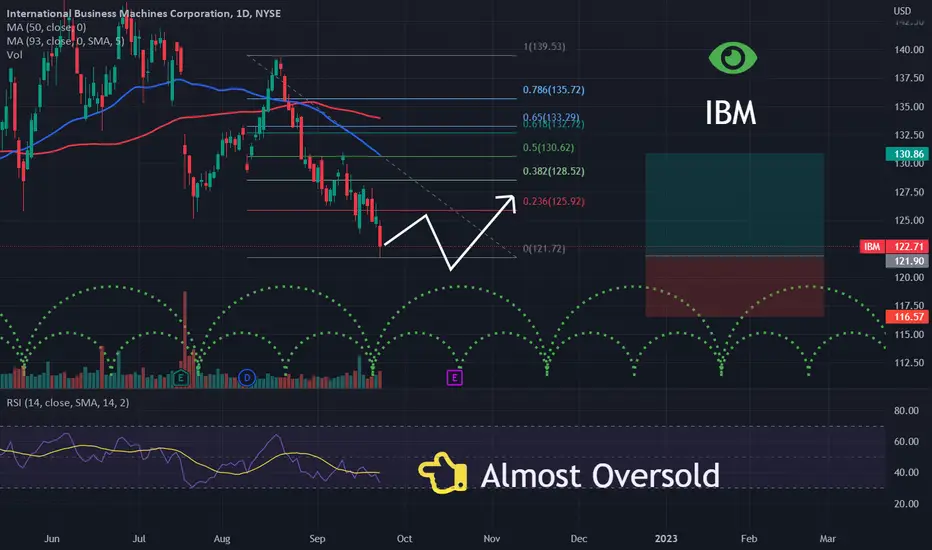
Rising WedgeBearish W that terminated near the 1.618.
Price has hit target 1 of the down targets and is below the bottom trendline of the rising wedge.
Price broke upward from this wedge.
No recommendation.
We have had a few down market days in a row. Perhaps recession fears are hitting folks, but how quickly this market forgets. The market will be reminded once again. There will be possible chop and rallies up when we least expect it. Be safe.
Short with a possible pause or even a bounce at each target down.

Education: Topping Tail And Resulting Drop On $IBM + Buy LevelThis is a fantastic example of a topping tail on the IBM chart. Note the topping tail is 1. at the highs of recent history, 2. The tail (wick) is 50% or greater of the entire candle length, 3. The body is 50% or less of the entire candle length and 4. the close is in the bottom 25% of the candle.
Note the 50% retrace the next day giving a great short entry and then the massive drop today. Target is the scene of the crime as noted on the chart. This becomes the buy level for a bounce.
Note: This is not financial advice, speak to your financial planner.

IBM ... Small bumps ahead ?Since mid-October IBM has produced a nearly 35% gain
This would appear to have traced out a bullish impulse wave (1-2-3-4-5)
It has also created a possible Wolfe Wave top with a short term downside target of $143-$144.
Additionally one could envision two harmonic patterns in development.
In the shorter term which a Gartley pattern supports the WW thesis.
The longer term a Bat pattern supports the 1/3 retracement scenario of the October move.
With an eye on the Fed's actions next week and broader equity markets I would be looking to sell IBM price strength with a tight stop should be breach recent highs.
I will follow up if I feel a short position is warranted.
As usual this is not investment advice, so do your own due diligence.
S.

IBM | Bullish trend | 4 Hr | 02\12\22
IBM is in bullish trend.
It is supposed to be in the bullish trend for the coming as Inverted Hammer is seen at HL2.
it is not a financial advice.


IBM investment ideaI hold IBM in my long term portfolio. It is great company and pays good dividends. I'm planning to hold it for years to come. Just added after the last drop. It delivered good earning results last week. Great moment to buy or add. This is not a trade, a long term investment.

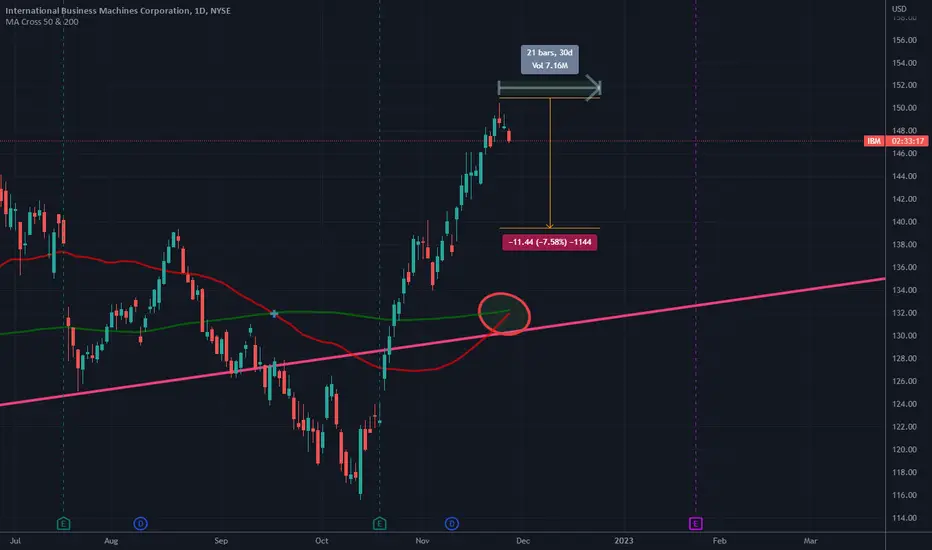
$IBM Golden Cross RejectionThere's no reason for a golden cross here. See the spinning top candle on the 1D chart at the top of the chart indicating a top.
You can bet that people have been betting against IBM for the whole time it's been mooning. The top is finally in, both in this stock and SPY/Macro in general. The only reason this has pumped was due to post-dividend distribution market mechanics in my opinion.
With dividend distributions completed + Net Capital times passed, it's time for this stock to dump along with the market.
IBM - Harmonics (theory)The first thing to look for when identifying the Bat pattern is the impulsive leg or the XA leg. We’re looking for a strong move up or down depending if we either have a bullish or a bearish Bat structure.
The next thing that needs to be satisfied for a valid Bat pattern structure is a minimum 0.382 Fibonacci retracement of the XA leg and it can go as deep as 0.50 Fibonacci retracement of the XA leg, but it can’t break below the 0.618. This will create the B leg of our Bat pattern.
How to trade the bat pattern
The next thing we’re going to look for is a retracement of the AB leg up to at least 0.382 Fibonacci ratios, but it can’t go above 0.886, and this will create our third point C of the harmonic Bat pattern strategy.
The last thing we want to establish is the D point and in order to get to the D point, all we do is to find the 0.886 Fibonacci ratios of the impulsive XA leg, which will result in a deep CD leg and finally it will complete the whole Bat pattern structure.
In the current scenario, I presented also a surprising correlation between the time cycles, where the X and A leg time frame could indicate potential CD range. As described above - if this scenario turns true and price action will indeed form a bullish harmonic bat here, the initial retracement could potentially reach levels of the previous low of this cycle (X).
This is just a tutorial and an idea for a potential Long, at the bottom of the formation and end of the current time cycle - nevertheless, I mark this idea as Neutral and place IBM in my 'watched' list.

Scanner on a another windowscould be handy when scanning for stock etc. to put the scanner window on my other monitor

IBM SELL ++++IBM is overbought and overdone. Can go to $152.57 If already short I would ADD at $150, $152, $154 etc. New moon phases begins and I would expect a correction to $144 then $140 in coming days. For options Jan 20, 2023 $140 puts look best

Rising WedgeThis is an example of a steep rising wedge.
Both trendlines slope up and contract at the apex.
This pattern is not valid until the bottom trendline is broken which is not gonna be too difficult considering the steep slope of this wedge pattern.
No recommendation.
Example of a Falling wedge which is Bullish and the trendlines narrow or contract to the apex, followed by a very steep rising wedge. A falling wedge is not valid until the top trendline is broken.
If price turns down here this would be a Bearish Nen Star that terminates at the 1.272. The Nen Star have valley 2 lower than valley 1 in the bearish version. Bearish harmonic patterns are only called bearish because they reverse down at the end of the 4th leg but can be very profitable as a long one were to get in at a good entry level on the 4th leg.
With the market as strange as it has been, price could go even further though.
If you do not know what to do, sometimes it is better to do nothing (bear market rallies can be a feeding frenzy, the big guys get full and move on so knowing when a move up is overextended can be very, very important.
This is also a W pattern that I am not delving in to in this post.
Good luck!

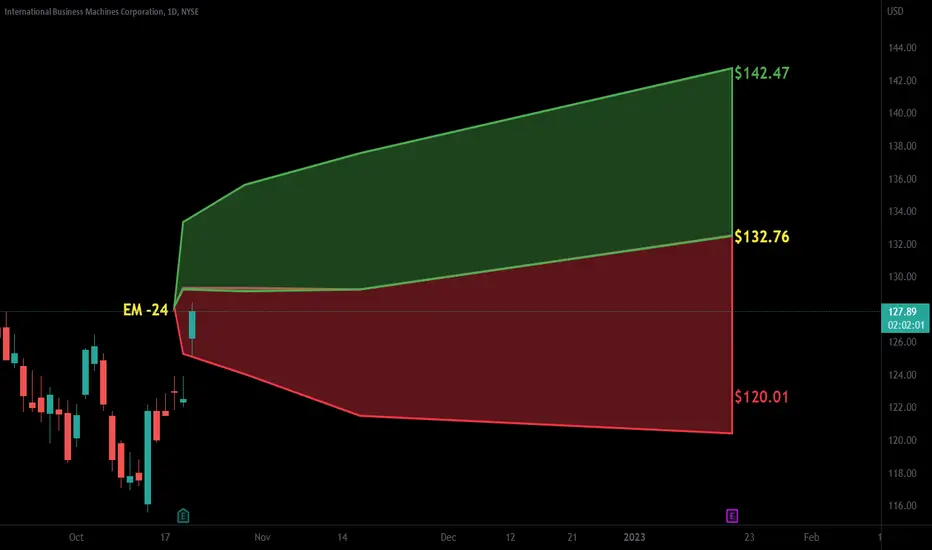
Selling IBM trend of lower highs.IBM - 30d expiry - We look to Sell at 134.98 (stop at 139.41)
The medium term bias is neutral.
Trading has been mixed and volatile.
Expect trading to remain mixed and volatile.
The trend of lower highs is located at 136.
Preferred trade is to sell into rallies.
Short term momentum is bullish.
Early optimism is likely to lead to gains although extended attempts higher are expected to fail.
Our profit targets will be 124.44 and 120.44
Resistance: 131.00 / 136.50 / 139.34
Support: 127.00 / 124.00 / 120.00
Disclaimer – Saxo Bank Group.
Please be reminded – you alone are responsible for your trading – both gains and losses. There is a very high degree of risk involved in trading. The technical analysis , like any and all indicators, strategies, columns, articles and other features accessible on/though this site (including those from Signal Centre) are for informational purposes only and should not be construed as investment advice by you. Such technical analysis are believed to be obtained from sources believed to be reliable, but not warrant their respective completeness or accuracy, or warrant any results from the use of the information. Your use of the technical analysis , as would also your use of any and all mentioned indicators, strategies, columns, articles and all other features, is entirely at your own risk and it is your sole responsibility to evaluate the accuracy, completeness and usefulness (including suitability) of the information. You should assess the risk of any trade with your financial adviser and make your own independent decision(s) regarding any tradable products which may be the subject matter of the technical analysis or any of the said indicators, strategies, columns, articles and all other features.
Please also be reminded that if despite the above, any of the said technical analysis (or any of the said indicators, strategies, columns, articles and other features accessible on/through this site) is found to be advisory or a recommendation; and not merely informational in nature, the same is in any event provided with the intention of being for general circulation and availability only. As such it is not intended to and does not form part of any offer or recommendation directed at you specifically, or have any regard to the investment objectives, financial situation or needs of yourself or any other specific person. Before committing to a trade or investment therefore, please seek advice from a financial or other professional adviser regarding the suitability of the product for you and (where available) read the relevant product offer/description documents, including the risk disclosures. If you do not wish to seek such financial advice, please still exercise your mind and consider carefully whether the product is suitable for you because you alone remain responsible for your trading – both gains and losses.

IBM 4HR ANTI BAT HARMONIC SHORTVery familiar stock Vol at about 7M pattern looks fairly clean could get in at entry, only paper trading this one myself.

IBM Is Approaching A Decent Short ZoneReward/Risk on this one is 3.28 with stop loss, first PT, as pictured and entries averaged across the zone.

$IBM with a Bullish outlook following its earnings #Stocks The PEAD projected a Bullish outlook for $IBM after a Positive over reaction following its earnings release placing the stock in drift B with an expected accuracy of 88.89%.
ID: 2022-04010.18.2022
inception price action
earnings trade: AMC 10.19.2022
manage on 10.20.2022 after reporting

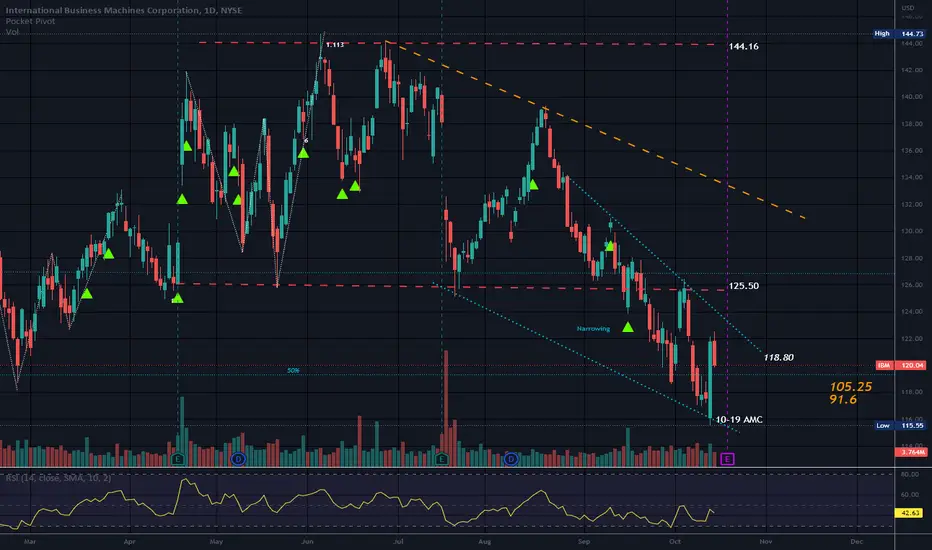
Rectangle has Broken to the Downside//Channel DownIBM appears to be in a smaller channel that is narrowing which is known as a Falling Wedge.
Price is below the bottom trendline of the Rectangle so that trendline is now resistance.
Channel down noted.
Price is just above the 50% retracement of the trend up.
EARNINGS 10-19 AMC.
No recommendation
Boring Stock, Getting Close to a Potential Long-Term BreakoutWaiting for a monthly close above the 8-year downtrend line to get in. The chart is pretty messy but many other signals are converging around that area (200-month EMA, 50-month EMA, .382 Fib). Price had a false breakout early in the downtrend based on the trendline I drew but I drew it where it is because it had many hits along this line. If price breaks out here I think it's significant because it would also be breaking above the 200-month EMA after dipping below temporarily (which it hadn't done for a really long time). I'm waiting for a monthly close above the 200-month EMA to start a position, and will plan on adding more if it can get about the 50-month EMA. I don't have a stop loss, this is a long-term buy and hold and collect the dividends if it can breakout. If it has a false breakout and goes down, I'll just buy up more at certain intervals and will update this idea. I think from looking at this chart and reading/listening to some of the other ideas about this stock that it can surpass the highs it made about 8 years ago and my price target is $270-$300 where I would start to think about using a stop loss and protecting profit. I like using stop losses eventually because it can let a stock potentially run rather than just selling when it hits the target. Anyway, waiting for another week to make a decision. If price ends up failing here, I think I will probably be able to get in down around $100 or maybe even a bit lower and I would consider starting a position there but I like buying on breakouts rather than trying to catch a "falling knife". One more thing on this stock, it hasn't participated much in the market recovery since the March lows from the covid panic selloff and that makes me like it also (just look at a long-term chart of Microsoft after the tech bubble, for a long time it pretty much traded sideways and now look at it, I'm not saying IBM will do the same but it could, I'm not one to limit the potential of the stock market long-term, over long periods of time it goes up on average).
**These are just notes about what I am personally considering doing and are not recommendations to trade. If you decide to follow any of this, trade at your own risk and keep a long-term perspective, I'm talking this trade could take the better part of a decade to play out (not weeks or months, that would be a short-term trade which is usually not for me).**

IBM | Insider Buying | Good EntryInternational Business Machines Corporation provides integrated solutions and services worldwide. The company operates through four business segments: Software, Consulting, Infrastructure, and Financing. The Software segment offers hybrid cloud platform and software solutions, such as Red Hat, an enterprise open-source solutions; software for business automation, AIOps and management, integration, and application servers; data and artificial intelligence solutions; and security software and services for threat, data, and identity. This segment also provides transaction processing software that supports clients' mission-critical and on-premise workloads in banking, airlines, and retail industries. The Consulting segment offers business transformation services, including strategy, business process design and operations, data and analytics, and system integration services; technology consulting services; and application and cloud platform services. The Infrastructure segment provides on-premises and cloud-based server and storage solutions for its clients' mission-critical and regulated workloads; and support services and solutions for hybrid cloud infrastructure, as well as remanufacturing and remarketing services for used equipment. The Financing segment offers lease, installment payment, loan financing, and short-term working capital financing services. The company was formerly known as Computing-Tabulating-Recording Co. International Business Machines Corporation was incorporated in 1911 and is headquartered in Armonk, New York.
International Business Machines (IBM) Analyze!!!💻International Business Machines Corporation is an American multinational technology corporation headquartered in Armonk, New York, with operations in over 171 countries.
IBM was able to make a Head and Shoulders Pattern near the resistance line and resistance zone.
IBM broke the neckline & support line at the same time, and I expect that IBM will go down at least to the support zone and Head and Shoulders Pattern's Target.
International Business Machines(IBM) Analyze (IBMUSD), Daily Timeframe⏰ (Heikin Ashi).
Do not forget to put Stop loss for your positions (For every position you want to open).
Please follow your strategy, this is just my idea, and I will be glad to see your ideas in this post.
Please do not forget the ✅' like '✅ button 🙏😊 & Share it with your friends; thanks, and Trade safe.
