INTC BULLS GET READYINTC had some bullish catalysts and is overall a great company. I like the stock, i buy.
The overall market might be overbought right now and jumping in at the current price might prove to be unprofitable. This is why we break this trade down to four different steps.
Phase 1: Wait until short term price goes from uptrend to downtrend.
Phase 2: (Optional) Short INTC so you can buy more and faster!
Phase 3: ???
Phase 4: Profit
What do you think will happen?
INL trade ideas

Breakout.Intel is headed for a breakout toward 42 dollars on bullish news we have good volume above the resistance line at 35.

INTC Shares Up 16% in Just One WeekINTC shares have underperformed in the tech sector for years (due to equipment obsolescence and a lack of innovation as well), but last week was the best week since July 2009. The reason for the rise is related to the hype around AI.
According to rumors, the company has released a new processor that shows good results when training neural networks. And one analyst opined that Intel could gain a competitive advantage from its acquisition of chip maker Habana Labs/Gaudi.
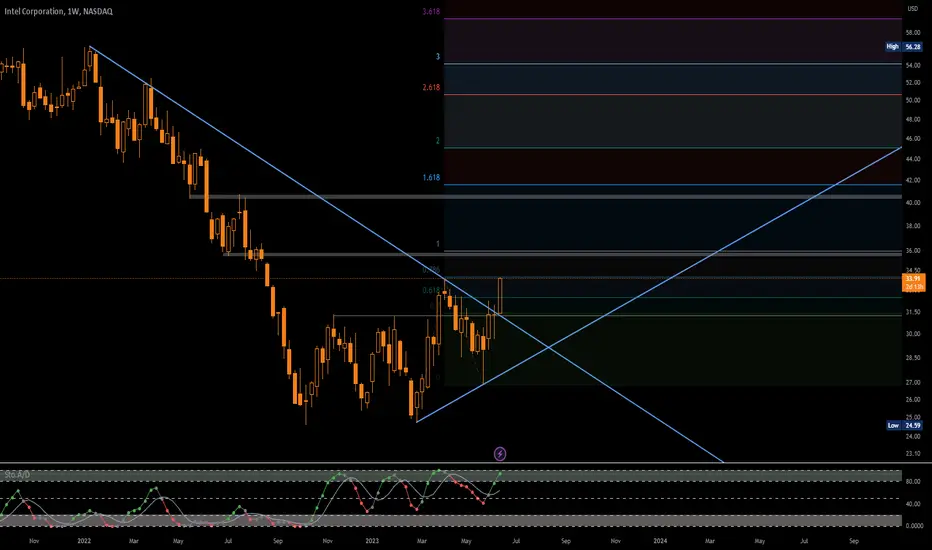
INTC's stock chart shows that INTC's stock price bounced off the lower end of a long-term up channel after hovering between USD 25 and USD 30 per share for a long time. It was probably an accumulation range when large market participants formed an investment position. Now we can expect the USD 30 level to serve as support. On the other hand, the strong level of USD 42.50 per share of INTC starting in 2018 could provide resistance.
On Friday, Morgan Stanley analyst Joseph Moore raised its price target for Intel shares to USD 38 from USD 31. But if the bulls continue to act as actively, the target levels for the INTC stock may be raised again.
This article represents the opinion of the Companies operating under the FXOpen brand only. It is not to be construed as an offer, solicitation, or recommendation with respect to products and services provided by the Companies operating under the FXOpen brand, nor is it to be considered financial advice.

Trading INTC on the bullish side into its earning
Arm is talking to at least ten companies, including Intel Corp, Alphabet Inc, Apple Inc., Microsoft Corp., TSMC, and Samsung Electronics Co Ltd., about their potential participation in the IPO.
Slated for release in 2025, the all-new Falcon Shores design will be Intel's flagship foray into the AI chip sector. The company's recent announcement offered a small, but noteworthy glimpse of what the new chips will offer.
Intel Capital Portfolio invests in companies shaping the future of Cloud, Devices, Frontier and Silicon, the four domains that feed into the future of compute.
Intel has my support the next few years No big deal really. I am just supporting the market after taking profit with NVDA stock.
Supported Intel for many years and will continue to do so.
Market is bullish and next few years should show some positive return.
My strategy is money flow and investors are always diversifying to keep
the growth curve in their portfolios.
Happy supporter.
good luck intel market

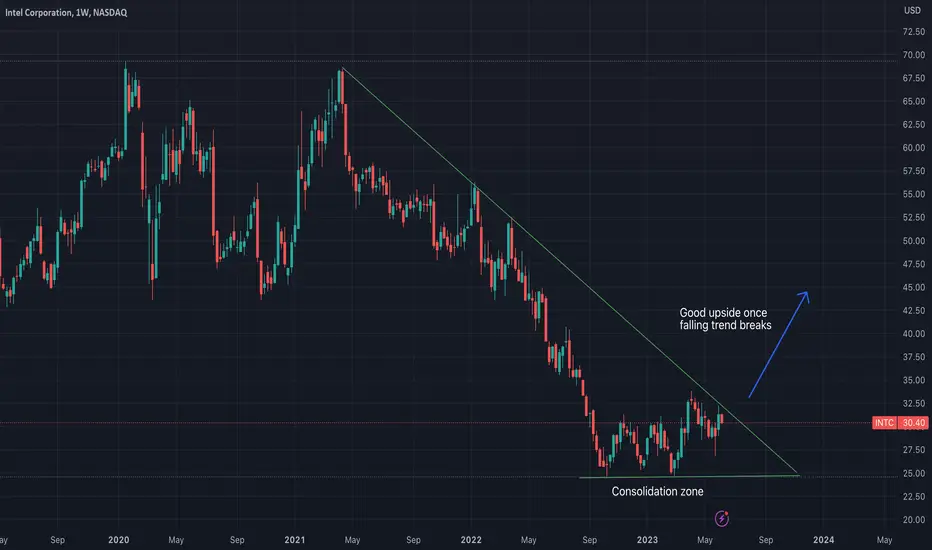
INTC BULLS GET READYINTC has been performing lately in accordance to other semiconductor companies in the sector.
The stock has been underperforming the market because of various market and management issues. I believe INTC will gain a larger market share in various industries by 2025 and by then the price performance gap will be closed between other semiconductor companies.
Meanwhile I will long INTC as i see fit.

INTC nearing Breakout Intel Corporation after heavy consolidation on chart, showing signs for downward trend break and upside. Long consolidation will help this stock to break on upside with good volume.
INTC 5/13/2023INTC
No more microchips!
Daily chart analysis
INTC entered a downtrend May 2022 and price continue to tumble up until Oct. 2022.
Price entered a Distribution stage and started to move sideways.
In April 2023, price broke above the sideways range but quickly fell back into range. The breakout is now deemed a “false breakout”.
Currently, price has bounce down off the resistance level after the false breakout. The bears are showing they are in control.
We are in a downtrend and at resistance level of sideways range. This will give us entry to trade short.
The initial target will be a swing to the lows of the sideways range. The second target will be the continuation of downtrend.
Entering trade short.
Entry: 28.95
Stoploss: 32.19 (-11.19%)
Target 1: 25.43 (+12.16%), 1.09 RR Ratio
Target 2: 16.80 (+41.97%), 3.75 RR Ratio

Calls ideaI just bought a bunch of calls exp. on 06/16 strike 31.5. I think is going to test the $33.60 level after breaking out the channel.


Watchlist 2023-06-07 $PACW $ZION $BABA $CVNA $INTC $LAZRAMEX:SPY failed to get under the important support at 426 early in the session PD which led to a small rally, giving it back mid day, but then finishing strong into the close and AH. PM session is showing strength trading nears the monthly highs at 430. As yesterday was a trend day to the upside, with up stock having 4X the volume as down stocks, I anticipate todays range to be slightly more muted unless we can get past the 430 resistance or the 426 support. In either of these cases, watch for the retest of the levels to get in longer term positions in that direction, and vis vera, watch for fakeouts to get into short positions in the opposite direction.
For further confirmation of a trend day, watch for:
USI:ADD pinned near +\-2000
USI:VOLD ratio over +/- 3
USI:TICK cumulating past 0 wicking to +/-900
Regional Banks - trading with elevated PD vol. if banks can get over PD high, there is room in most names to the upper end of the next range
Support Resistance Inflection
NASDAQ:PACW 8.0 8.5, 10 8.5
NASDAQ:ZION 30 31, 33 31
NYSE:FHN 11.40 11.75, 13.4
Chinese ADRs - Lower as a group to start after data overnight showed exports in May suffered a sharp drop of 7.5% compared to the previous year, vastly exceeding the minor 0.4% fall predicted by a Reuters poll. Watching for weakness off the open and joining a retracement for a short.
NYSE:BABA ,
Other Watches:
NYSE:CVNA - over 15.00 if there is a minor flush off the open that is quickly bought.
NASDAQ:INTC - over 31.50 if chips see some life back in them.
NASDAQ:LAZR - buying on dips near 7.0
Comment what you are watching!


Capturing Reversal Opportunities - Dual Trade Idea for INTC StocGreetings, traders! Today, I present a dual trade idea for INTC stock that encompasses both short and long positions. Let's explore the details of each trade to maximize potential profits and manage risk effectively.
Short Trade Idea:
We begin with a short trade opportunity, entering the market at $31.31 and setting a stop loss at $32.21. Our target for this short position is set at $24.74, providing a compelling risk-reward ratio of approximately 1 to 6.57. Through careful analysis, I identify bearish momentum which signaling a potential downside move.
Long Trade Idea:
Following the completion of the short trade, we anticipate a reversal in price action and the emergence of a bullish opportunity. We aim to open long positions at $24.49, setting a stop loss at $23.81 to manage risk effectively. Our target for this long position is set at $37.58, offering an impressive risk-reward ratio of approximately 1 to 13.09. This trade idea is supported by our analysis of potential bullish catalysts and favorable technical patterns.
By combining both short and long trades, we aim to capitalize on the market's potential for price swings, positioning ourselves to profit from both downward and upward movements. This dual strategy allows us to adapt to changing market dynamics and maximize potential gains.
Please note that trading involves risks, and this trade idea is for educational purposes only. It is essential to conduct your own analysis, consider your risk tolerance, and, if needed, seek advice from qualified professionals before making any trading decisions.
TRADING as a BUSINESS wishing you success in your trading endeavors as you navigate the opportunities presented by INTC stock.

INTC, 10d+/-24.97%falling cycle -24.97% more than 10 days
==================================================================================
This data is analyzed by robots. Analyze historical trends based on The Adam Theory of Markets (20 moving averages/60 moving averages/120 moving averages/240 moving averages) and estimate the trend in the next 10 days. The white line is the robot's expected price, and the upper and lower horizontal line stop loss and stop profit prices have no financial basis. The results are for reference only.

INTEL zoomed outnot going to say much! No Brainer. all above support is money in the pocket.
With the chip A.I. times and intel have new leadership and new bright future. and NVDIA saying intel chips looked oke.
easy trade long short and midterm.
ENJOY!
Safe al!!
Stone Capone

Watchlist 2023-06-01 $SOFI $LCID $BAX $INTC $CHPT AMEX:SPY slightly higher as the debt ceiling bill passes in the House, will now move to the Senate. Garnering bipartisan support, the bill to suspend the $31.4 trillion debt ceiling was approved and is set to be delivered to the Senate. With a Monday deadline looming, the Senate is expected to pass the measure before the government exhausts its ability to pay its bills. Key Res for today is 4.19, 420.50, PD inflection and pivot high. Key support today is 417.5. 416.
For further confirmation of a trend day, watch for:
USI:ADD pinned near +\-2000
USI:VOLD ratio over +/- 3
USI:TICK cumulating past 0 wicking to +/-900
NASDAQ:SOFI - SoFi's stock surge continues as debt-ceiling deal brings 'highly positive development'. There's no question after looking at the last two days that sofi is hot right now. Particularly interested in starting a position near the 6.50 range support and also the 200 ema. If we see buying. Above this level there is plenty of room to go 7.50 and 8.00.
NASDAQ:LCID - Lucid Group's stock slides 10% premarket after EV company announces $3 billion stock offering and private placement. Short under 6.65 as long as 6.88 can confirm as resistance first. If there is no confirmation of sellers they this can be susceptible to a fakeout that rallies if it quickly reclaims 6.65
Support 6.65
Resistance 6.88
Inflection 7.00
NYSE:CVNA - over 14.00
NYSE:BAX - no news but had an impression aftermarket vol bar after trending down for the last month. 1.9 PMP vol and 3 RVOl yesterday. Looking to see if buyers decide this is the day for a trend change.
NYSE:CHPT - keeping an eye on CHPT for a second day play, preferable taking a long near support 9.25 for a swing trade, must BO form the 9.80 for confirmation.
Chips:
Profit taking PD for chips as NASDAQ:NVDA , NASDAQ:MRVL , NASDAQ:MU all heading lower. Looking for dips into key levels, and BO's from consolidations where there is at least 2 touches of a level.
Other Watches:
NYSE:AI
NASDAQ:INTC - over 32
Comment what you are watching!

INTEL !!!!!not going to say much!
With the chip A.I. times and intel have new leadership and new bright future. and NVDIA saying intel chips looked oke.
easy trade long short and midterm.
ENJOY!
Safe al!!
Stone Capone

INTC round two... 3% and Run with more upside.Looks like Intel is setting up again... will be patient with this one.
Looks like INTC does not have the strength (at this moment) to break through the downtrend.
Wait with trade when it will get back to a daily base.
If it breaks support at 28.90 get out.
If there will be a break out... 3% and Run
Entry - 29.00-29.40
PT - 30.25
SL - 28.90

$INTC , Analysing Trends, Patterns, and IndicatorsNASDAQ:INTC
Greetings, fellow traders! I am thrilled to present my analysis and insights on TradingView, where I will be sharing trend analysis, chart patterns, and technical indicators to help you navigate the exciting world of the stock market. It's important to note that I maintain a neutral stance and base my decisions solely on identifying promising opportunities.
As an observer of market trends, my goal is to provide you with comprehensive and visually appealing charts that showcase the potential opportunities I see. Please remember that I am not a financial advisor, and any investment decisions you make should be thoroughly researched and evaluated based on your own risk tolerance and financial goals.
In each analysis, I will walk you through the patterns and indicators I have identified, highlighting key support and resistance levels, trendlines, and other critical technical aspects. My approach is to objectively present the information and allow you to interpret it as you see fit. Whether you choose to go long or short in the stock market is entirely up to you.
My main focus is to share the knowledge and insights I have gained from studying charts and technical analysis. By doing so, I hope to contribute to your trading journey and help you become a more informed and confident trader. It is important to continuously learn and adapt to the ever-changing dynamics of the market.
I invite you to join me on this exciting journey as we explore the fascinating world of trading together. Feel free to provide feedback, ask questions, and share your own perspectives in the comments section. Your engagement and participation are greatly appreciated.
Remember, trading carries risks, and it is essential to conduct thorough due diligence before making any investment decisions. I am here to provide information, but the responsibility lies with each individual trader to make their own choices.
Thank you for taking the time to explore my charts. I hope you find value in the insights I share, and may they contribute to your trading success. Happy trading!
Disclaimer: I am not a financial advisor. The analysis and opinions expressed here are solely based on my observations and should not be considered as financial advice. Please consult with a licensed professional before making any investment decisions.

I am short INTC 29.67 look daily chart heading into the 50 day with no vol
We have more selling buying
and lower highs
know look weekly chart to right look stoch heading down
so that means any rally gonna fail u can see daily stoch on bottom
that why I am in small shares at first.
Target 28 that breaks then 25
stop is 30.47

$INTC with a bullish outlook following its earnings #StocksThe PEAD projected a bullish outlook for NASDAQ:INTC after a positive over reaction following its earnings release placing the stock in drift B with an expected accuracy of 57.14%.
INTC breaking symmetrical triangle target 23.91Probably due to news and fundamental issues (China, Nvdia, etc..) INTC has not finally been able to break the MA 200, breaking down a symmetric triangle with target on the support on 23.91$.

INTC 3% and RUN15/05/2023
1st PT - 3% and Run - 29.79
OPT - 31.10 - 31.80
SL - 28.45 - Move to breakeven when it will be close to 3% gain.
When 3% gain will get reached move SL to 3% gain.
3% and RUN...
CCI on -97
RSI on 43
SMI curling up signal crossover
