Johnson & Johnson | Fundamental Analysis | Must Read...Johnson & Johnson is a leader in several areas of pharmaceutical research, including oncology and immunologic diseases. The company's portfolio of drugs in these two areas brings in billions of dollars in revenue each quarter. The company is currently seeking to strengthen its market share in COVID-19 vaccines.
This year, Johnson & Johnson anticipates generating $2.5 billion from sales of its COVID-19 vaccine, well below the $33.5 billion and $20 billion, respectively, expected by Pfizer and Moderna. Fortuitously, some up-to-date developments favor Johnson & Johnson's ambitions in this profitable market.
Most COVID vaccines currently available in the U.S. are given to patients in two doses about a month apart. J&J's vaccine is injected in only one dose. Based on real-world data and Phase 3 clinical trials, the company is sure that a single dose of its vaccine is 75% effective against severe cases of COVID for at least 28 days after vaccination.
This efficacy compares disadvantageously with the effectiveness of vaccines marketed by Pfizer and Moderna, as well as a vaccine developed by Novavax, which has not yet received emergency use authorization (EUA) in the United States. All three vaccines have proven at least 90% effective in preventing COVID in clinical trials.
Nevertheless, Johnson & Johnson recently revealed data showing that a booster dose (or second dose) of the vaccine, given two months after the first dose, improves its effectiveness to 94% against the onset of severe COVID. On Oct. 5, the company applied for EUA approval from the Food and Drug Administration (FDA) to administer a second dose of the vaccine.
Then, on Oct. 15, a panel convened by the FDA voted unanimously for the agency to issue the company an EUA approval. The last wek, the FDA granted the company this long-awaited approval.
In addition to getting the green light a little later than some of its competitors, Johnson & Johnson's COVID vaccine faced several obstacles. In mid-April, health authorities decided to suspend the distribution of the vaccine after it was suspected of causing blood clots in some patients (the original EUA approval was granted in late February).
Regulators canceled that suspension about a week and a half later, arguing that the known benefits outweighed the known risks and requiring a new warning on the vaccine label going forward. Indeed, six patients out of more than 6.8 million vaccinated were known to have been affected by this adverse event. This episode is now left behind, but since the pandemic is not yet over, mainly because of the more dangerous delta variant of the virus, the need for vaccines remains.
Since the second dose of the J&J vaccine seems to increase its effectiveness, this can only have a positive effect on its sales. This is especially true given that the FDA has not placed any health-related (or similar) restrictions on who can get a second dose of the vaccine from Johnson & Johnson. But here's the catch: the company has pledged not to profit from the product for the duration of the pandemic. In other words, boosted sales of vaccines will have no meaningful impact on the bottom line in the short term.
In the future, the company may profit from its vaccine when the pandemic fades and if COVID becomes a seasonal disease like the flu, as some predict. But even then, given how competitive this market is, the J&J vaccine will have only a very moderate influence on a company that typically makes more than $10 billion in profits a year.
In other words, investing in Johnson & Johnson because of its COVID vaccine is not a good idea. Luckily, there are plenty of other reasons for that. Consider the company's diversified operations. Its pharmaceutical business, the largest by revenue, includes quite a few blockbuster products whose sales continue to grow.
Here are a few of them: in the third quarter (ended Sept. 30), revenue from the immunosuppressant Stelara was $2.4 billion, up 22.2% from the previous quarter. Oncology drug Darzalex increased its sales 43.7% year over year to $1.6 billion. This is just the tip of the iceberg for the company, with several dozen late-stage programs in development.
Expanding its product line and approving new drugs is commonplace at Johnson & Johnson. Its consumer health products segment sells over-the-counter products with broad appeal, including Listerine, Neutrogena, Aveeno, and Tylenol. The company's medical device business adds to its revenue base.
Here's another reason to invest in this company: the company has increased its dividend every year for more than 50 consecutive years, making it the Dividend King.
The company currently has a yield of 2.53%, higher than the S&P 500 Index's 1.38%, and maintains a conservative cash payout ratio of 47%. That makes it engaging to income-seeking investors. In other words, Johnson & Johnson may not be the best stock to buy the COVID vaccine, but it remains a solid pharmaceutical company to invest in.
JNJ trade ideas

JNJ : Johnson & Johnson NYSE Bottom reversalJNJ: Johnson & Johnson NYSE. NYSE:JNJ
support at $162.25; near target $167.45, Next $172 and then $180.
Net Income 2018-2020 3years in a row reach $14-15Billion!!!
Go Long!!! BOW Buy on Weakness

Johnson & Johnson|Fundamental Analysis|Price action| MUST READ!In a nutshell, Johnson & Johnson's third-quarter results were generally good. The company reported a 10.7% year-over-year increase in revenue to $23.3 billion. Adjusted earnings per share rose 18.2% to $2.60, well above the consensus estimate of $2.35.
Given the large earnings outperformance, you'd probably think the health care company's stock should have rallied Tuesday after the quarterly report was released. And you'd be right. J&J stock opened up about 1% and gained even more momentum during the day. Perhaps the rise would have been greater had it not been for the company's third-quarter earnings, which came in below analysts' average forecast of $23.7 billion.
But there was more to this story for the health care giant than just the underlying numbers. Here are three things you might have missed about Johnson & Johnson's third-quarter results.
First and foremost, three products accounted for 63% of the growth.
Many investors love Johnson & Johnson largely because of its diversification. The company has three multi-billion dollar business segments targeting different areas of healthcare. Hundreds of products are sold in these segments. In 2020, J&J claimed 28 products or platforms with annual sales of more than $1 billion.
Although Johnson & Johnson's business is broadly diversified, the drivers of its growth in the third quarter were not. Just three products accounted for about 63% of the company's total revenue growth. These products accounted for nearly 90% of J&J's pharmaceutical sales growth.
Not surprisingly, the COVID-19 vaccine tops the list. It brought in $502 million in the third quarter, up from no revenue the previous year.
The multiple myeloma drug Darzalex took a respectable second place. Sales of the drug totaled $1.58 billion in the third quarter, up 43.7% from nearly $1.1 billion in the same quarter in 2020.
J&J's Stelara drug was the third-largest growth driver in the third quarter. Sales of the plaque psoriasis and psoriatic arthritis drug totaled $2.38 billion in the quarter. That's a 22.2% increase over sales of $1.95 billion in the previous quarter.
Second, it's important to keep in mind that the COVID-19 pandemic continues to have a major impact beyond just the vaccine.
Johnson & Johnson's COVID-19 vaccine certainly contributed significantly to the good third-quarter results. And it could make an even bigger furor in the future. J&J is likely to benefit significantly from booster sales (if, as expected, it gets approved for boosters). However, COVID-19 also continues to have a significant impact on J&J's fortunes beyond the vaccine.
Johnson & Johnson's consumer health business, for example, has been helped by increased sales of the drug Tylenol. The company noted that some of the increase in sales of the over-the-counter drug was due to its use to relieve vaccine-induced symptoms. J&J also reported that sales of ORSL HCP electrolyte drinks increased due to relief of COVID-19 symptoms.
It wasn't all good news, however. Sales bans in parts of the Asia-Pacific region had a negative impact on sales of baby care products. The company said growth in sales of its Imbruvica cancer drug was partially held back by COVID-19-related dynamics. In addition, sales of J&J's orthopedic medical products in the spine, sports, and other category fell mainly because of the impact of COVID-19 on the market.
Finally, the company is now on the cusp of an international tipping point.
Although based in the U.S., Johnson & Johnson has been a major competitor in global markets for most of its history. And now the health care giant is nearing a crucial international stage.
In the third quarter, J&J's U.S. sales rose 7.9 percent year over year to just under $12 billion. Its international sales jumped 13.8% to $11.4 billion. International markets now account for 48.7% of total revenue. At the current rate of growth, by next year more than half of Johnson & Johnson's revenue will come from outside the United States.
Investors should see this as a decidedly positive trend. Greater geographic diversification of revenues could make Johnson & Johnson even more stable than it is now.

JONSON & JONSON D1The prices of shares of pharmaceutical companies have dropped significantly since the beginning of autumn. Like many other stock market assets. Today, the Coronovirus situation is starting to worsen! The number of patients and deaths is increasing every day. And this is not surprising. Because the vacation season is over and the inhabitants of the whole planet have gone to study and work. Increasing contact between people will certainly increase the number of sick people. Also, the onset of the cold season will contribute to new diseases. That will give an opportunity for pharmaceutical companies to make good profits. Johnson & Johnson also released a new drug for psoriasis. And he is actively working in other branches of medicine.

JNJ will it continue droppingFrom the way JNJ just broke through the closest support level and from the way that price hasn't been able to close beyond it again we expect JNJ to keep dropping until the next closest support level.

A Major Top FormingThis Appears to be in the process of forming a Major Top after a very long uptrend, This could end up being a very large correction potentially cutting prices in half.

STOCK IN AVOiD LISTJOHNSON AND JOHNSON IN AVOID LIST....Stock already in daily time frame which already extended and may be entering in weekly timeframe Correction....SO may be Stock Expected to Trade in Range for next one year


Head and Shoulders Pattern on JNJ In the 4 hour chart, we can see head and shoulders pattern which is now going to the last shoulder. Price has good support @162. Traced a Fibonacci to set my TP. Not financial advice!

JNJ expecting lowerI got this in meditation and Idk if it's a problem with their "vaccine" or what, but the sense is it'll be trending down. I also looked at the chart and it reminds me of a head and shoulders.
This is just posted as a journal.


JNJ LONG CALL clear parameters in place main trend still bullish lower timeframes have clear support double bottom entry is breakout of minor resistance

JNJ: buy opportunity here?hello everyone. there is a long scenario for JNJ here. i will open long position after break out.

IRON TARIHi guys,
this iron condor is 4 weeks, 8% strike.
With a "small" strike of 8% in one month we still have very high probability to earn the max premium, a nice 85%
Subscribe for free!!
Enjoy your wallet!
Tari

JNJ Daily TimeframeSNIPER STRATEGY
This magical strategy works like a clock on almost any charts
Although I have to say it can’t predict pullbacks, so I do not suggest this strategy for leverage trading.
It will not give you the whole wave like any other strategy out there but it will give you huge part of the wave.
The best timeframe for this strategy is Daily, Weekly and Monthly however it can work any timeframe above three minutes.
Start believing in this strategy because it will reward believers with huge profit.
There is a lot more about this strategy.
It can predict and also it can give you almost exact buy or sell time on the spot.
I am developing it even more so stay tuned and start to follow me for more signals and forecasts.

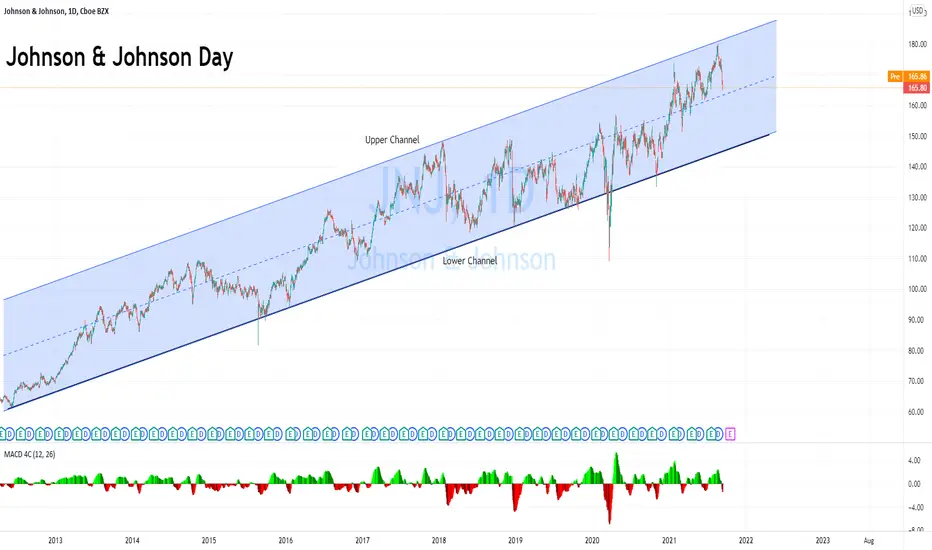
JNJ on Day time frameJohnson & Johnson TF Day
1. The price is running in the parallel channel of uptrend.
2. You can open BUY ORDER when the price reach the lower channel.
JNJ: BUY THE DIPJNJ: an amazing long opportunity
~Every time JNJ has gone overbought on the RSI like it is right now, it has gone up very strongly
~JNJ is trading in a parallel uptrend for the most part since October 2020 (white area) with a few minor outlying price action movements.
^^ Price is touching the long term support line. Confirming the RSI foreshadowing.
~I expect resistance at 171, 174-176, 180.
^^Breaking 180 will let it soar to 185-187 (the top of the parallel uptrend)

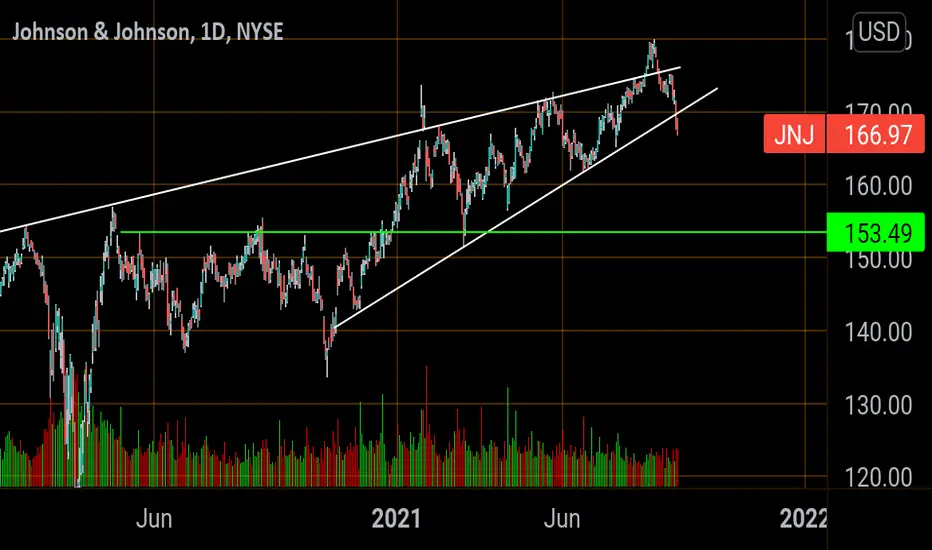
Correction for JNJ... Rising wedge patternI expect a dead cat bounce to follow the Dow then a sell off.
TP 153-155
JNJ Bull9/17 $180 CALLS currently going for $0.26.
All vaccines are looking like they want to run (PFE, NVAX, MRNA) etc

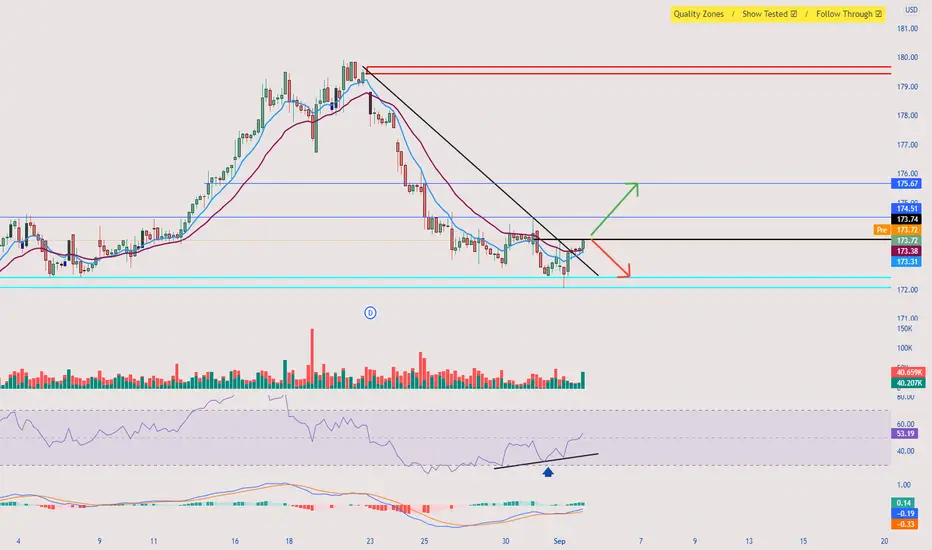
One more jump before downtrend?JNJ has been coming off a slow moving uptrend and it seems to be slowing down
- JNJ looks to test the previous high
+ Fibonacci extension has reversal at $168.5
+ Bottom of the channel has reversal at $169.87 - $169
- RSI is heading close to oversold
- Price broke through pitchfork so it looks to hit reversal in the next day or so
- If the price high tomorrow is under $171.12 that is a good indicator of jump
- Price target: $173.22

168 bounce coming?I like JNJ, but would like it to travel down to 168 before breaking through my purple fib trigger line.

$JNJ - Double bottom & breakout in hourly, watch for contiuation$JNJ - Double bottom & breakout in hourly, watch for contiuation