JNJ short...I am taking a short JNJ trade set up. Monthly is bullish. No sign of topping yet except we can see price is pulling back. Weekly is at resistance of Kijun and prices are consolidating under. Daily is bearish and once this support gives me we can tag 200 sma and possibly lower at highlighted support. Earning are next week. Trade carefully
JNJ trade ideas

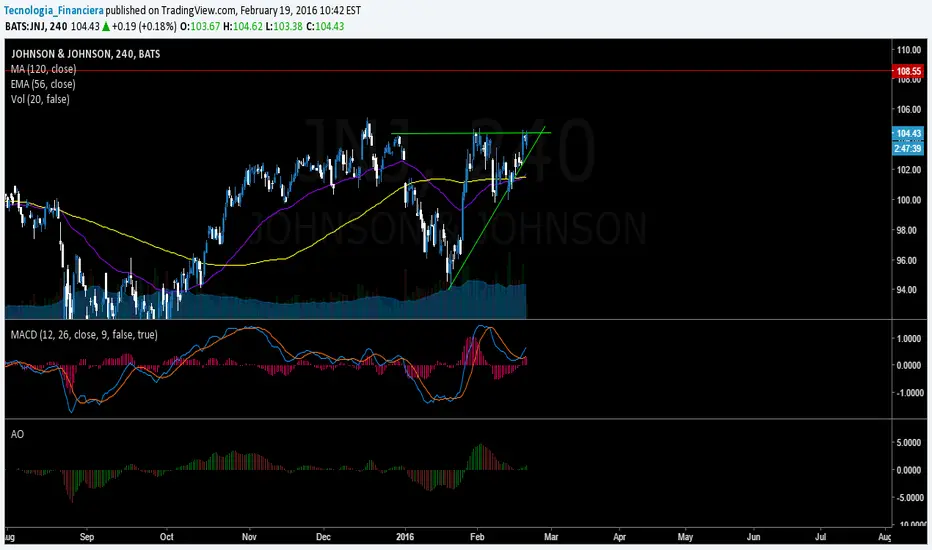
JNJ looks convincing !!Trend line support
with confluence of Kijunsen
Indicating end of correction in primary uptrend supported by bullish hidden divergence in RSI.


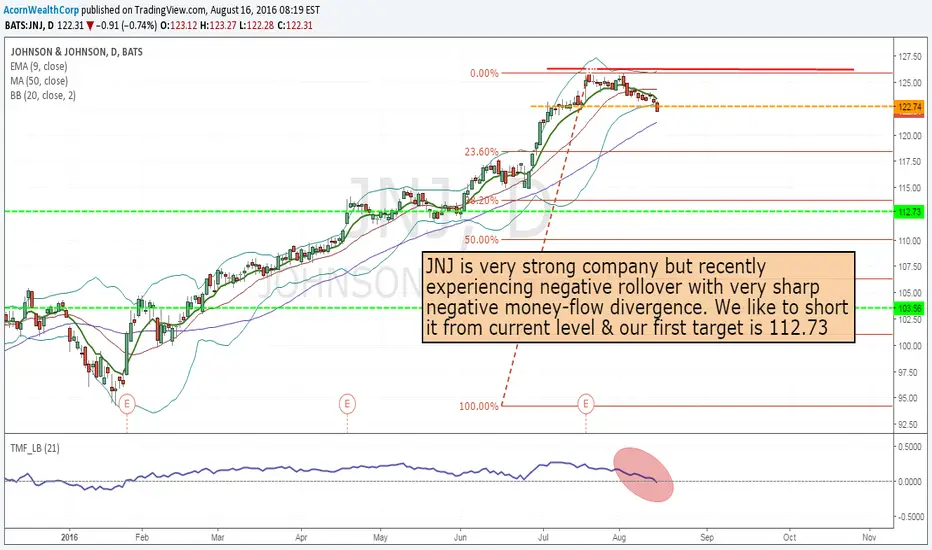
JNJ- short from today's open JNJ is very strong company but recently experiencing negative rollover with very sharp negative money-flow divergence. There are also insider selling as well.
We like to short it from current level & our first target is 112.73
On the option side we are looking for Jan17- 120 put currently trading at $3.90
"You can check our detailed analysis on JNJ in the trading room/ Executive summery link here-
www.youtube.com
Time Span: 6:40"
Trade Status: Pending

JOHNSON & JOHNSON triangle Patternthe Ascending triangle is a bullish chart pattern used in technical analysis that is easily recognizable by the distinct shape created by two trendlines. In an ascending triangle, one trendline is drawn horizontally at a level that has historically prevented the price from heading higher, while the second trendline connects a series of increasing troughs.
Traders enter into long positions when the price of the asset breaks above the top resistance. Wait for the breakout of the structure before entering the trade. Beware of the red resistance level shown.
Español:
El triángulo ascendente es un patrón gráfico alcista utilizado en el análisis técnico que es fácilmente reconocible por la forma distinta creada por dos líneas de tendencia . En un triángulo ascendente , una línea de tendencia se dibuja horizontalmente a un nivel que ha evitado históricamente el precio siga subiendo , mientras que la segunda línea de tendencia alcista que conecta una serie de bajos mas altos.
Los traders suelen entrar en posiciones largas cuando el precio de la acción rompe por encima de la resistencia superior . Esperen a la ruptura de la estructura antes de entrar en el trade . Cuidado con el nivel de resistencia de color rojo mostrado.

UPTRENDLONG. SE OBSERVA UN TRIANGULO ASCENDENTE. COMPROBADO EN SU MOMENTO DE RUPTURA (LINEA VERDE) POR LA APERTURA DE LAS BANDAS.


ST: JNJ - at support01/21 - 01/29 strong bullish move.
01/04 gap + 01/28 spinning top + 02/03 re-test
--------------- my plan-----------------------------
If the price goes above my entry line, watch for a intraday bullish trade.
If the price moves below my stop line, the odds are gone. Take JNJ off the list.
If the price moves below the stop line but then form something else around 100.83, uh.. we'll see...

JNJ: Wedge within wegdeThe price route in the chart is just one possibility among many. A clear signal is to be waited before taking action.


JNJInside week and nearly went hammer to but, not quite Still struggling to make a signal recently the stock hit support and rally to $102 and it’s seems to have an little support at $95 and held up In my prediction That is weak to rely on when the stock flips.


JNJ Strong buyGood earnings. Rising dividends for 52 years. Doing well in Biotech, an up and coming sector. Hopefully it will start doing some more small M&A deals and release the 10 blockbusters it said it will over the next 5 years. NYSE:JNJ


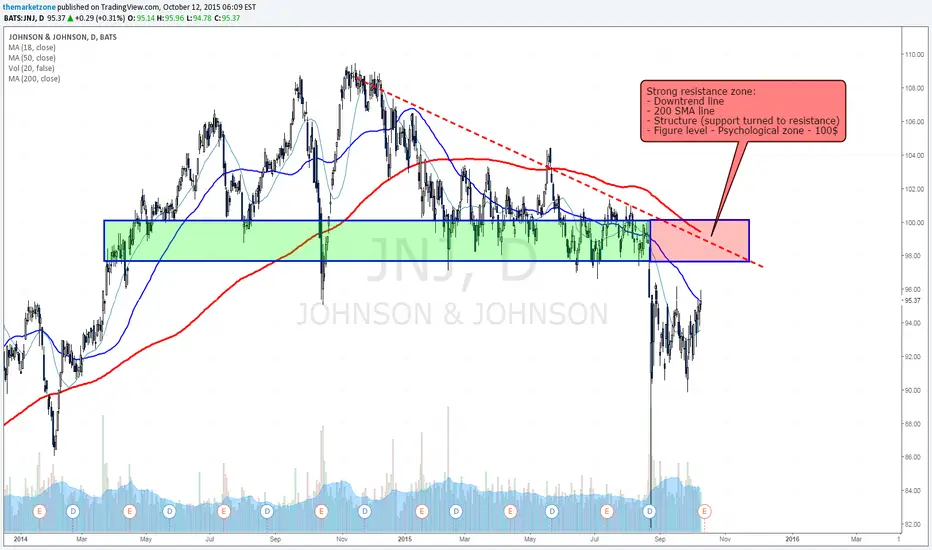
Basic analysis shows JNJ is about to face strong resistanceA very basic analysis for $JNJ shows that the stock is facing a major resistance zone before earnings.
The 98-100$ zone, a strong structure that held as support during more than a year, was broken during August and now became resistance.
Add the 200 SMA line, the downtrend line and the sellers pressure that this stock will face when it will reach the psychological number of 100$ and you'll get pretty good reasons to be concern if you are still holding a bullish position in $JNJ.