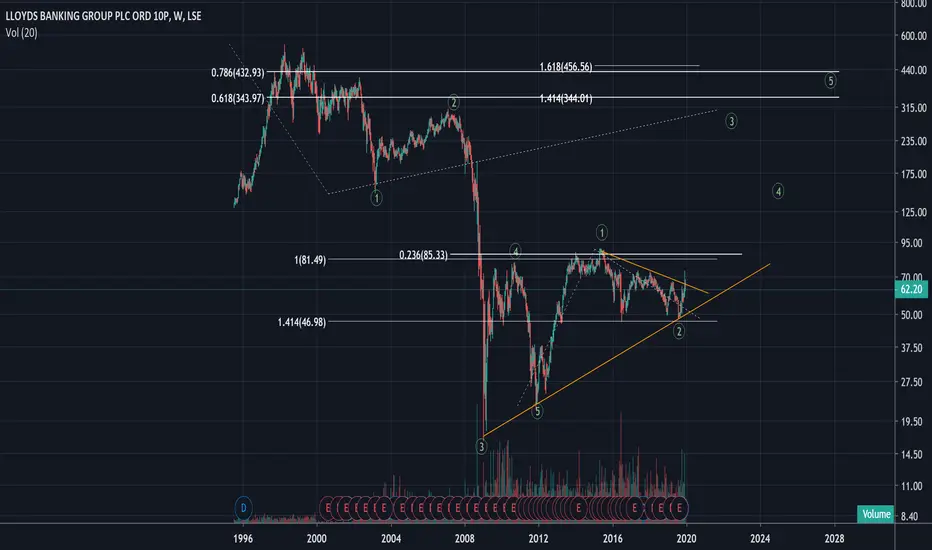
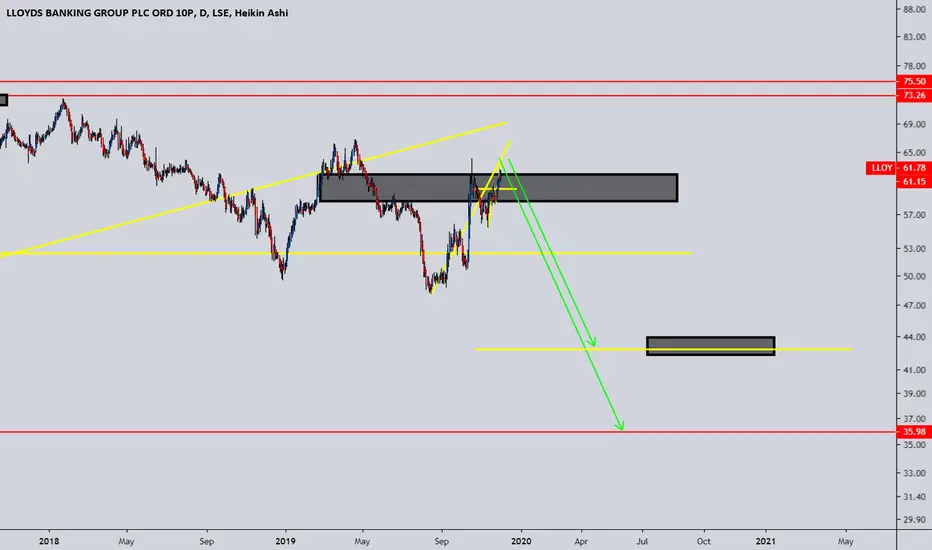
Lloyds updateIt's been a while since my previous update for Lloyds. If you have been following along you will know that I have been anticipating lower prices. Now that more data is being printed we can begin to suggest possible scenarios. If you are a student of Elliott Wave or Neo Wave you will know that the middle part of a correction is the hardest part to comprehend and this is where I feel Lloyds is currently. One scenario that I have is the above (which also has confluence with Barclays), where we are currently in an X wave flat which is connecting the two larger pieces of the puzzle. This has further confluence with the current economic outlook. I do not trade based on fundamentals, but it's difficult to ignore that the banking industry is set to be greatly affected by the Covid-19 pandemic. A break above the macro 0.618 with a weekly close will change my bias and I will flip long. Good luck and trade safe if you are following the banking stocks. I do feel that, if played correctly, a very good opportunity is approaching in this sector.
LLD trade ideas

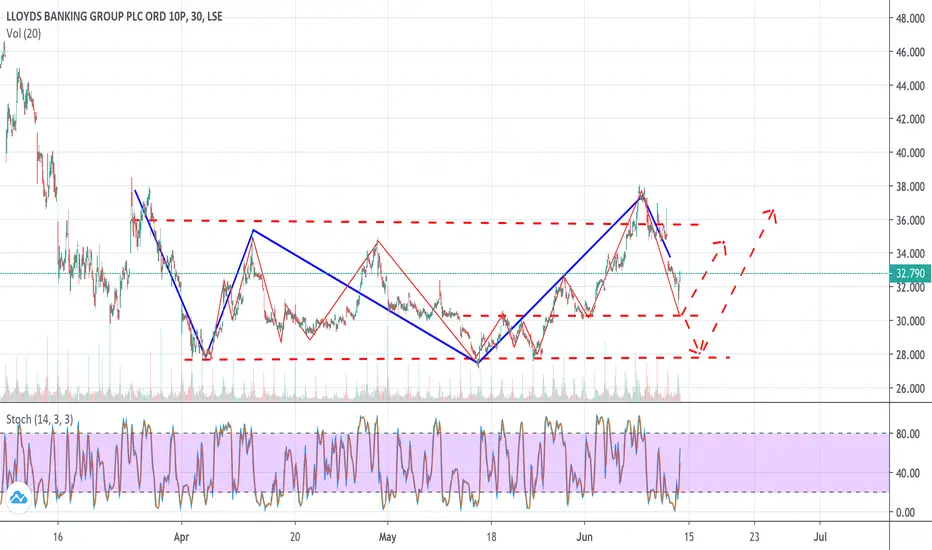
Lloyds updateIn a recent post I outlined my expectations for Lloyds and my bias remains. As you can see I am anticipating a combination correction. I have this in mind due to the wave extension which we experienced in early April. Whenever you have such an extended wave like this you should anticipate a complex correction (complexity always precedes or follows a wave extension). In this instance I have a W,X,Y correction. In a W,X,Y each wave will have a standard pattern, here I have W wave as flat correction (the is a Fibonacci relationship between wave A and C) and I am now anticipating a 3 wave move to bring Lloyds to the range lows. I'm currently long from the 0.786 and targeting the monthly.

Short opportunityLLOY stock is showing a bullish trend, sellers are coming in, big short opportunity for a quick profit.

LLOY - LLOYDS BANKING GROUP Technical AnalysisIt seems that prices are moving at the bottom side of a channel.
The idea is to go long.
LSE:LLOY
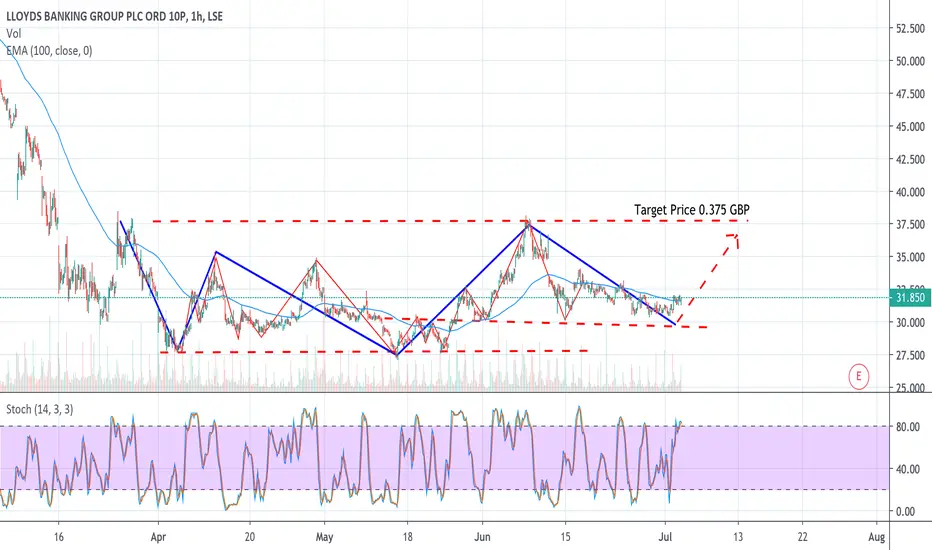
Is Lloyds approaching the bottom of the range? In my last post I wrote about identifying and trading the range and how the patient trader will be rewarded when a range is in play. lloyds has been ranging in corrective mode since the March sell-off and is now approaching the bottom of the range. It appears to have put in a flat as a B wave (with a C wave failure). If so this is telling us that the market is weak and the lower targets are on offer. A 1/1 extension of the A wave would see Lloyds hit 26.20 pence and a C wave extension would see Lloyds hit the 0.786 of the macro move. This would be an ideal entry for a professional knife catcher! Good luck if you're trading Lloyds.

Lloyds. Trade the rangeLloyds has provided traders with some excellent set-ups as it remains range bound. These are significant ranges and the patient trader can make excellent returns as the technicals are being respected to the tick. It will interesting to see how the market reacts over the coming weeks because the UKX has faced rejection from the 0.618. Will Lloyds revisit the bottom of the range for a SFP?

Short Lloyds BankLloyds bank has created a head and shoulders position, this indicates a fall in price.

LLOY - LLOYDS BANKING Technical AnalysisThe idea is to go long.
Just wait the end of the price retracement (it can be now, if the support will not be broken).
LLOYLloyds Banking Group
Key Technical Drivers:
Strong volume candle structure
Elevated volume
8 and 21-EMA bull cross and trending up
MACD cross
Currently at 137 – higher targets probable: 144 and 156. Stop: 124

LLOYDS - new sell signal, lets see!Last buy trade hit our TP3 for 1:3, new sell signal has formed.
For more information on our strategy please view our 'Scripts' page on our Trading view profile.
Our V2 strategy shows the SL and multiple TPs on the chart too - these are customisable based on the ATR of each pair.
We have set these so that TP1 is 1:1 TP2 is 1:2 TP3 is 1:3 RR.
There are infinite ways to manage your trades to suit your mindset and time.
Works on all instruments
Directly onto your own personal trading view - all devices work
Non repainting
Please follow us to keep up to speed with our trading ideas, live streams (coming soon) and weekly recaps using our strategy.
We are continually marking some tweaks and marginal gain improvements to continue to make this easier for our trades and even more profitable. All updates are given to our members and previous purchasers FOC .
Regards
Darren
Blue FX

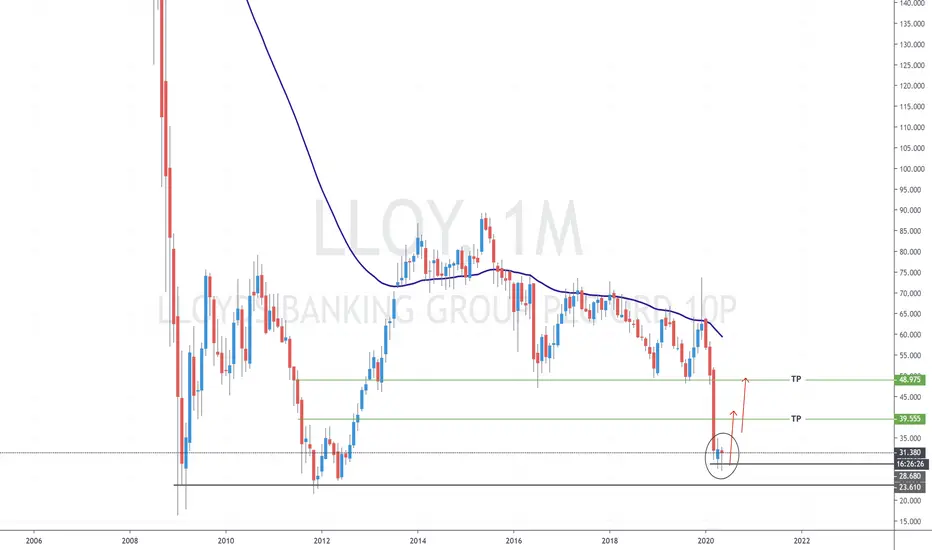
LLOY or LLoyds 1M | Market View- Favoring the bullish scenario. Possible bullish price movement towards the next resistance $39 and $48 within the next period.
LIKE | SHARE to support our work.
A Daily support bounce offers long opportunity
LYG bounced from a daily support. In H1 TF, we have a breakout and a retest from a small H1 range. A long opportunity presents itself with different targets.


#LLOY ANALYSIS.. After the big drop, we see a recovery in the price of the stock.. At the point we have reached, there are indications that the positive outlook in the stock will continue..
First of all, when we look at the daily chart, we see that the downtrend has broken upwards and the price is below ma20.. Also, the RSI is now above (42) reference values, which seems very positive.. Besides these, SAR indicates a positive trend and Gator is about to generate a buy signal.. In the framework of all these positive indicators, I think there will be an upward price movement in #LLOY, as I mentioned in the chart.. We will wait and see..
Disclaimer: When it comes to stock trading, please take necessary care. Invest in your own responsibility. What I write is technical analysis. It is not investment advice..
I wish you all the best..

LLOY TREND ANALYSISwe firstly see candlesticks responding to the strong descending trendline (RED) and also a H&S pattern (BLUE BOX) both of these give a possible indication for a bearish continuation. Lastly there is a continuation wedge (BLUE) which generally results in a break out downwards. this would give even more reasoning to go short. I would take profit at around £25 the lowest price since 2012. once that price hits be sure to be looking for entry's to buy 1 once analysis is done !


38.2% & POSSIBLE 61.8% Retracement LONG GWAVE38.2% & POSSIBLE 61.8% Retracement LONG GWAVE.
FIB Retracement Percentage is calculated in a Higher Cartesian and or Euclidean Dimension.
PLEASE ALWAYS WAIT FOR STOCHASTIC CONFIRMATION!!! THANKS.

LLoyds has been flat-lining LLoyds has been flat-lining for almost 7 years
If it convincingly breaks 63 then the only way is up.
Wait and see.


Lloyds - Banking on a move higher.Buy Lloyds Banking Group (LLOY.L)
Lloyds Banking Group plc is a provider of financial services to individual and business customers in the United Kingdom. The Company's main business activities are retail and commercial banking, general insurance, and long-term savings, protection and investment.
Market Cap: £40Billion
Lloyds gapped higher this morning and looks set to close outside of the wedge pattern that has formed on the daily chart. A continuation higher looks possible. The next major resistance to target is 66.8p.
Stop: 55.5p
Target 1: 66.8p
Target 2: 73.50p
Target 3: 80p
Interested in UK Stocks?
Join our free Telegram channel for up to date analysis on the best main market opportunities in the UK right now - t.me
