LMT - MyMI Option PlayLockheed Martin not only landed on a fundamental price level today (The price that it was at before Covid March 2020 Market Crash), but it also acquire roughly a $1B in Volume total, 2nd to JNJ. We like it for the continue concerned across seas that seem to be gaining more and more tension. Whether it's Ukraine/Russia or the worries in Asia, we will be looking to place some CALLs (ITM) to hold at least back to $458 to confirm that a Support to Resistance Conversion is not being completed.
If so, Lockheed could potentially lose support at the $440 Levels and move back down below the 410-420 Price Levels
Regardless, we will be playing options to create a new positioning moving forward.
LOM trade ideas

$LMT with a Bullish outlook following its earnings #Stocks The PEAD projected a Bullish outlook for $LMT after a Positive Under reaction following its earnings release placing the stock in drift A with an expected accuracy of 75%.
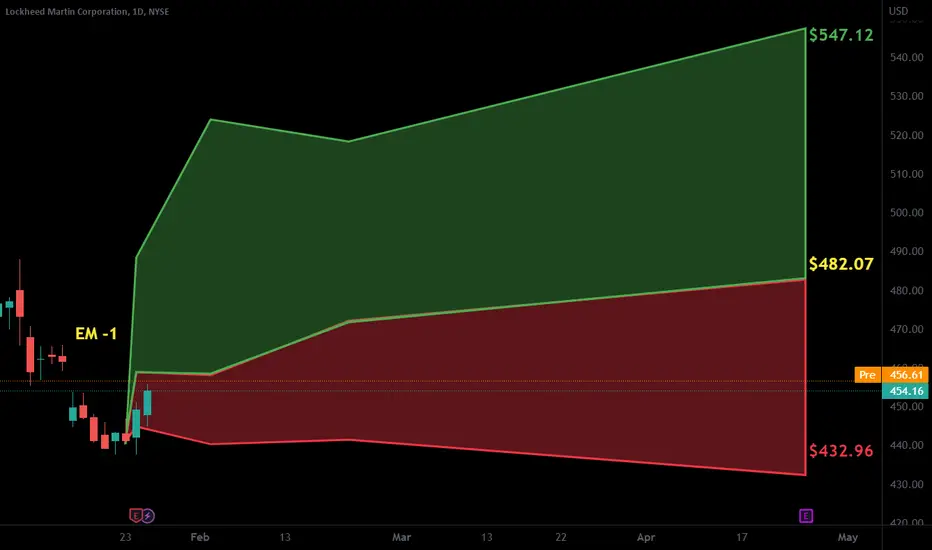
$LMT 1-25-2023Updated chart for supply (red) and demand (green) zones. Strong past two days even with a largely red market today. Still looking to fill the gap at 459.19.

Rectangle/Stop The WarNeutral until broken.
When will the American people wake up?
Stop the War we are funding! A lot of folks are getting rich with every dollar we send, and it is not the tax payor!
I am not sure how many dollars are pocketed by corruption and oligarchs with each Billion we supposedly send to Ukraine.
Ukraine is not a democracy. Put you hands over your ears when the lies are spread per media.
No recommendation.
US defense contractors see longer term benefits from war in Ukraine!!!!
When O'Bama was in office, the Russians took Croatia. It is merely fate that now they are supposedly taking Ukraine.
Our country says Ukraine is winning. This seems unlikely but folks will believe the media if they hear it over and over and over.
Our mainstream media is used against us. This is only my opinion and everyone has one (o:
Somebody is getting rich off this so-called war, and it is not me.

LMT PullbackI sold off some of my long term LMT holdings last week before EOY to capture some capital gains. LMT was a big winner of 2022 up over 37% and price was stalling at the All Time High.
This morning I received an alert for an opening price spike that created a critical low at 469.35. This is not a spike I would take as a reversal to go long. Rather, I am watching to see if price breaks this low to signal a breakout short.
If the short breakout triggers I would look for a pullback to the 50% Retracement of the last earnings rally around 445.

LMT is 1st must-own investment in 2023Lockheed Martin ( NYSE:LMT ) could be trading at $700 (currently $485ish).
The bull case continues to unfold as Lockheed Martin benefits from (at least) three major tailwinds.
Favorable market and economic developments benefiting value stocks;
Improving global defense spending - that's a long-term benefit;
Lockheed's ability to deliver the right products and improve its business.
Over the past 12 months, all major defense contractors outperformed the S&P 500. Lockheed Martin, which was the second-best performer in the industry.
In this case, it's not just the war in Ukraine but also China's pressure on Taiwan and de-globalization, which causes global defense spending to rise.
The United States is stepping things up. The new omnibus package includes a 10% defense spending increase to $858 billion. This number is much higher than the 4% increase President Biden originally targeted. Defense contractors are now finally able to move on from the Continuing Resolution. These numbers indicate that the defense budget will have grown at 4.3% per year over the past two years - even after inflation. The average was less than 1% between 2015 and 2021. This is a significant shift in spending.
Lockheed Martin's stock price peaked in 2020 when the pandemic hit.
In 2023, sales growth is expected to be just 0.8%, after a 2.7% contraction in 2022. These two years are some of the weakest in recent history. In 2024, sales growth is expected to pick up, with higher growth expected after that. Moreover, the company hiked its dividend by 7%. LMT shares now pay a $3.00 per quarter per share dividend. This translates to a 2.5% dividend yield.
Lockheed's total return of the past 12 months exceeds 40%. In other words, a lot of good news has been priced in.
The company is now trading at 14.6x 2023E EBITDA of roughly $10.0 billion. This is based on its $127.5 billion market cap, $12.6 billion in expected net debt, and $5.7 billion in pension-related liabilities. A forward multiple of 14.6x is everything except cheap. It's a fair valuation given the bigger picture.
Needless to say, I believe that LMT is a must-own investment . The company has a stellar business model, anti-cyclical behavior, subdued volatility, and the ability to outperform the market on a long-term basis while providing steadily rising income through dividends.
Please feel free to express your ideas and thoughts in the comment section.

Possible bullish setup on LMT Making a new idea because put the wrong symbol on the other on lol. Looks like a bull triangle could be forming on LMT, but Dividend payout is tomorrow Dec. 30th. Looking at previous payout dates the stock fluctuated $6-$8. Cautiously bullish until it breaks rising support for this triangle. Let me know what you think.

Possible Bull Setup on LTMSaw what looks like a bull triangle forming on LTM. Dividend payout is tomorrow Dec. 30th. Based on previous payout dates the stock fluctuated up and down about $6-$8. Cautiously bullish on this unless it breaks below rising support.

LMT Lockhead Martin ripping higher- but bewareLog scale monthly
Trend channel from the early 2000's, cloned and stacked on top to form 2nsd channel
strong bullish candle in October, with weak follow in Nov and so far this month of Dec 2022. We're at the top of the channel. Technically is a higher probability short since we have 5 waves up from the low in Jan 2021.
Near-term:
Target would be Fib 13 at $441
Long-term:
Higher target is Fib 21 at $698 Near Mar 2026
Lower Target is Fib 8 at $280
If we see price slowly trend higher over the next few months, we may be starting a new channel

LMT.NYS_Bullish Pullback Trade_LongENTRY: 480.62
SL: 445.54
TP: 494.93
- ADX>25
- Daily RS +ve
- Daily FFI -ve
- Weekly RS +ve
- Weekly FFI +ve
- Moving averages are aligned.
- Breakout on 18 Oct 2022 from downtrend channel.
- Looks ready to test ATH.
Entry based on following:
- Pivot Point: Pullback since 8 Nov 2022 peak to near pivot level (455.31) and reacted well with rebound.
- TPB Daily VZ: Pullback from 11-16 Nov 2022 was within TPB Daily valuezone and breakout of it on 17 Nov 2022.
- Stoch RSI: Crossing up 20.

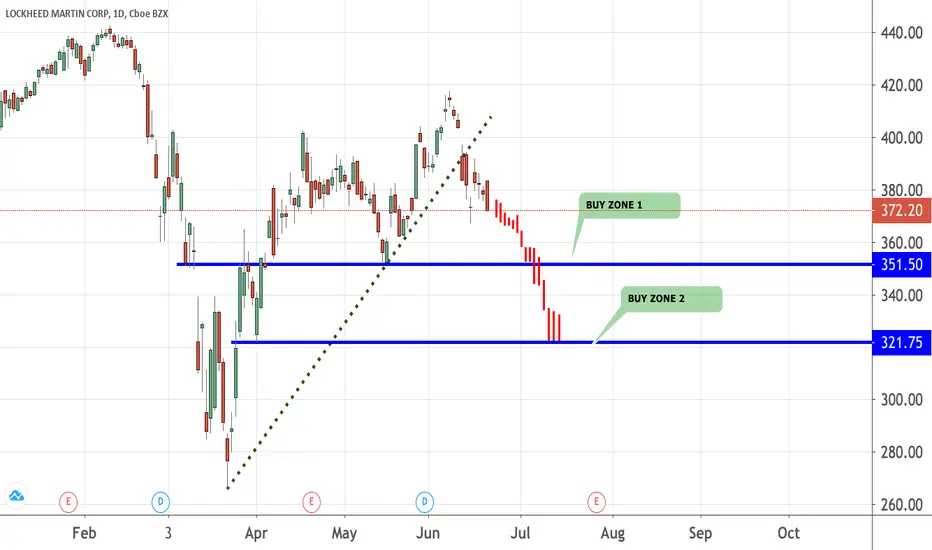
Understand correction is for accumulation (not all stocks apply)Sometimes, I get questions from members or followers when they see a correction, they think of sell.
Well, technically , they can but again it is not a question of buying or shorting only. You gotta understand your own profile as a trader and/or investor. For example, I seldom short stocks but rather accumulate them when there is a correction.
Some of the companies include
Amazon
Facebook
among many others that I have in my portfolio.
Lockheed Martin has been on my watch list for a while but for some reasons, it keeps going up and thus I have no chance to buy it.
I hope this correction will offers me the buying opportunity that I am awaiting.... There are 2 levels that I expect the price to retest before it rebound again.
Let's review in a few weeks time.
uber bullish on $LMT #LMTI am uber bullish on $LMT #LMT
I have no idea about its fundamentals or technical or what exactly this stock does. I just know that #Aladdin indicator has a buy sign on the Monthly timeframe. It is not financial advice. I usually am clueless. And I am usually very very wrong.

LMT , LONG This one caught my eyes originally because it was making ATH's during bear market ...ended up getting me in once months back but not working, except for my stop loss at the time , which worked great ;)
Yesterday we had our signal , and I was busy focused on a crucial day at work and could not do my typical break near close to consider entries in final 30 min , but I was able to enter first thing this morning .
Not quite a TT's candidate yet because we don't a have gap from pivot highs to pivot lows where the pivot high is at an ATH but good RS and definitely a trade here for me . We do have a nice 1/2 gap however, highlighted . 1/2 is a gap from low to low .. less powerful than a TT's gap but still notable strength.
Trade management - standard procedure .

A very good breakout. Slower stock but 5 star. This is a 5 star breakout, a bit late as a result of news but a 1.5% stop works well here.
Tradingview requires me to type more. TA is easy and shouldnt require lots of typing.

Defense Sector Setting Up ($LMT)$LMT setting up as well. Very similar picture as $GD. Out from big multi month base, and price is now tightening up above the 10 day moving average.

trend resistance zones here, longs be cautious ⚡RSI + trend resistance, also lower volume this breakout compared to last time.
All bearish signs in my opinion, I expect a dump to 420 area before a potential bounce 👀 drop a boost and follow for more! thanks


Stay the course with LMTWe just had a huge bull run, and hopefully it continues. This is a solid HOLD in my opinion (or you could trim some gains). Buy back in or increase position when PE <18.

$LMT losing momentum, and at ATH’s w/ rising rates$LMT losing momentum, and at ATH’s w/ rising rates

Lockheed Martin Bull PennantThis is a monthly chart of the defense company Lockheed Martin (LMT).
As you can see, a bull pennant is appearing.
In my experience, I have found that the most valid bull flags or pennants usually retrace back to the Golden Ratio (0.618), then bounce and continue higher (see below chart).
When this occurs, the measured move up is typically one full Fibonacci spiral from this retracement level, which usually occurs over a period of time that is about the same as the period of time it took the bull flag or pennant to form (see below chart)
The above chart suggests that LMT could climb into the 500s or as high as about 600 by the second quarter of next year. The best time to enter a trade would probably be after the seasonal volatility ends, and after a breakout occurs on some lower timeframe.
From a regression standpoint, this bull pennant formed when price rose from the mean to the 1 standard deviation, and retraced to the 0.5 standard deviation. If it pans out, the measured move may reach one full standard deviation higher (to the 1.5 standard deviations). See below chart.
To learn more about the log-linear regression channel that I used here, you can check out my prior post that described it in more detail:
Obviously, anything can happen. Not trading advice. Please do your own research and trade at your own risk. If you disagree, I welcome respectful comments and charts below.
Disclosure: I have no trade position in LMT and do not plan to open any trade at the current time.

Comments before financial release——Lockheed Martin Corporation Lockheed Martin Corporation (LMT)
Lockheed Martin Corporation is reporting for the quarter ending June 30, 2022. The aerospace and defense company's consensus earnings per share forecast from the 4 analysts that follow the stock is $6.29. This value represents a 11.78% decrease compared to the same quarter last year. In the past year LMT has beat the expectations every quarter. The highest one was in the 1st calendar quarter where they beat the consensus by 3.54%. Zacks Investment Research reports that the 2022 Price to Earnings ratio for LMT is 14.90 vs. an industry ratio of -10.10, implying that they will have a higher earnings growth than their competitors in the same industry.

late to the party but we'll take what we can get havent looked at this in a minute unfortunately, found the monthly 20sma and 2020 high/low .786 as support, the weekly macd is at the bottom of its megaphone channel, weekly stoch about to break out of a pennant, and we are about to have the strongest weekly/monthly close since the covid wipe. could this mean western capital interest are getting prepared for deeper war?

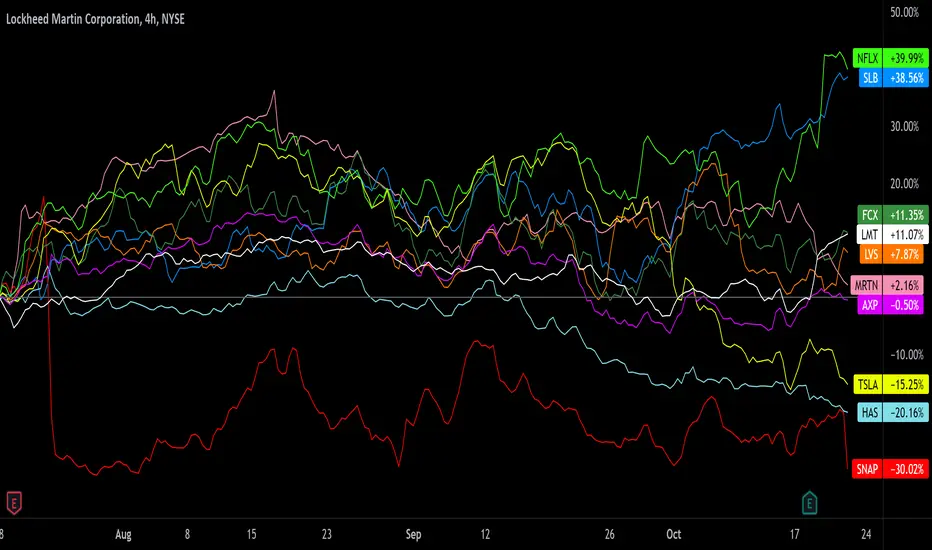
This week's earnings winners & losersThis week's earnings winners & losers 10/17 - 10/21
up
10/17 LMT
10/18 NFLX
10/19 LVS
10/20 FCX
10/21 SLB
down
10/17 MRTN
10/18 HAS
10/19 TSLA
10/20 SNAP
10/21 AXP
Do your own due diligence, your risk is 100% your responsibility. This is for educational and entertainment purposes only. You win some or you learn some. Consider being charitable with some of your profit to help humankind. Good luck and happy trading friends...
*3x lucky 7s of trading*
7pt Trading compass:
Price action, entry/exit
Volume average/direction
Trend, patterns, momentum
Newsworthy current events
Revenue
Earnings
Balance sheet
7 Common mistakes:
+5% portfolio trades, capital risk management
Beware of analyst's motives
Emotions & Opinions
FOMO : bad timing, the market is ruthless, be shrewd
Lack of planning & discipline
Forgetting restraint
Obdurate repetitive errors, no adaptation
7 Important tools:
Trading View app!, Brokerage UI
Accurate indicators & settings
Wide screen monitor/s
Trading log (pencil & graph paper)
Big, organized desk
Reading books, playing chess
Sorted watch-list
Checkout my indicators:
Fibonacci VIP - volume
Fibonacci MA7 - price
pi RSI - trend momentum
TTC - trend channel
AlertiT - notification
tickerTracker - MFI Oscillator
www.tradingview.com