508-527 by Aug 5th, likely continuation from thereLRCX is completing wave 4 with a retest of old downtrend resistance for new support. Wave 5 will complete around 508-527.
After that it will consolidate and determine if that impluse is a larger degree wave I - if so it will continue to 600+
LRCX trade ideas

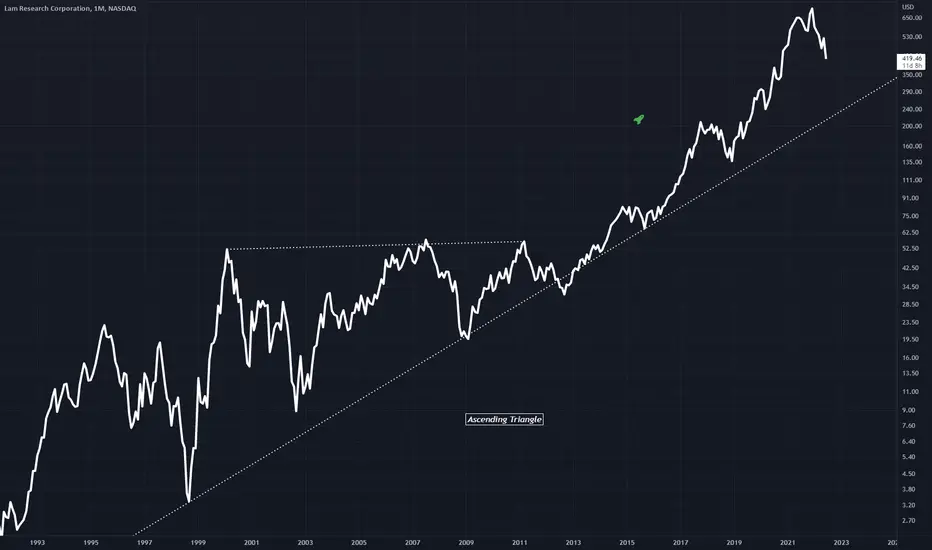
LRCX Ascending TriangleLRCX on the Monthly chart has shown a prime example of an Ascending Triangle, with bullish results
Chart pattern educational post


Expanding Triangle - 520 breakout levelLRCX very bullish yet very volatile setup. I posted recently but have recognized my initial count was not correct. The correct count is the following:
- LRCX is completing the final leg of an Expanding Triangle as the 5th wave of a larger Expanded Flat, which is the wave 4 of a larger motive sequence that started a decade ago off the low around 31.17.
- the B wave of the Wave 4 expanded flat was its all time high of 731.85 in Jan 2022, which was a 1.418 extension of the A of EF (thus, the A of 4)
- There are multiple indications that Friday May 20 was bottom (f leg of expanding triangle, c of v of C of 4):
1) pinbar candle on the daily chart
2) showed support at the A level around 450 and at the same time found support at the downtrend off the Jan high - the pinbar tail got bought up quick at that 450
3) 3 counts down off the e leg completed Friday May 20 - it is currently on second count of 3 up
4) the retracement of B of expanding flat showed equality with the previous extension at about 1.418
*Minimum target is the upper trendline of expanding triangle around 520 (should test that this week and attempt breakout)
**Intermediate target if we get breakout is 548
*** Goal target is new All time high above 731 (estimating 786) to complete wave 5 of the bullish impulse by August-October of 2022.
I will post a bigger picture view idea to reference for the overall counts, this idea was meant to focus on the zoomed in expanding triangle which indicates breakout is imminent. Interesting that breakout attempt is aligning time wise with NVDA earnings May 25. If they beat it would likely provide catalyst for the inductry to run and LRCX perfect setup to move big up.
Best,
A. Crawley

Supplement to previous idea - BullishHere is the bigger picture for LRCX, as referenced in previous post on expanding triangle.
We are currently at the transition from f of C of 4 and for the reasons outlined in last idea it is likely that wave 5 of the larger impulse is about to begin (or began May 20), to summarize:
- wave 4 was an expanded flat with an ending expanding triangle as the 5th wave of C ~1.418 retracement off B (the Jan highs, which was a 1.418 extension of A)
- initial target is 522, which will be the breakout level from the expanding triangle (this attempt should unfold by end of this week in alignment with NVDA earnings. If it fails, it is likely to drop to lower support of expanded triangle around low-mid 430s; if breakout is successful it will continue to the following targets in route to complete 5th motive wave:
*Intermediate target range 548-low 600s, point target 567
** goal target range 732-786 (which will be wave 5, precise level tbd and will send update if we clear 522 and intermediate level is realized
Catalyst = witchkraft

Structure BreakReversal and structure break means go long
Next level $535 are target.
Also early entry was daily inside bar play.
Not financial advice please use proper risk management

Bullish Near term to 558-590Expectation is bullish until end of May, then bearish in June to complete corrective wave.
Some confluence here using Elliot Wave, Harmonic Patterns, and Gann:
Primary EWT count gives recent completion of corrective A, next stop B. The details of this primary count are below:
- Impulse began 9/24/2012 (not shown) at 31.17
- Wave 1 completed 3/12/2018 (not shown) at 234.88
- Wave 2 retraced 55% of wave 1 and completed 12/24/2018 (not shown) at 122.64
- Wave 3 was a 271% extension of wave 1 and completed 6/1/2021 (not shown) at 637.80
- Wave 4 retraced 25% of wave 3 and completed 10/18/2021 at 535.01
- Wave 5 was apprx = wave 1 (97%) and completed 1/3/2022 at ATH 731.85
- Wave A completed 4/25/2022 at 449.50
* Wave B will likely extend to 557.35 (0.382 of A), 590.68 (0.5 of A), or 624 (0.618 of A)
** Wave C will need an update given the realization of actual level for B, however, based on the confluence (provided below) it is likely wave C will complete around 416 (0.618 of A) coming off wave B at around 590
(Alt. ABC Count (not shown in chart) would indicate the ABC already completed at A = 466.06 on 3/14/2022, B = 574.79 on 3/28 2022, and C = 449.50 on 4/25/2022; however, the subdivision count for this alt wave C is not convincing and it is more likely that level is the A of the primary count)
Confluence (supporting primary count):
- Projected minor bearish harmonic to complete D at corrective wave B level
- Projected major bullish Cypher (half shown, begins X in October 2021) will complete D at corrective wave C level
- Descending Gann fan off the wave 5 (All time high) showing lessening capacity for price (change in price to downside) to keep up with time (i.e. 1/1 angle about to be penetrated in favor of testing the 2/1 resistance – which will suggest wave B occurring in the time frame of 5/13/2022 – early June 2022). The price would then likely drop to test the 1/1 angle by end of June 2022 to complete the C (if rejected at the 2/1, thus completing B)
- Ascending Gann fan off the wave A swing low indicating price is staying in the upper section of fan and keeping up with time to the upside (exceeding it actually, which is bullish near term)
- RSI showing bullish momentum to take the price to Wave B
Not financial advice, but if you are curious how I am playing this:
- May 20 505 calls, hedge with May 13 450 puts (3 calls: 1 put). Will take profits if RSI crosses bearish or if price reaches 550s
- May 27 535 calls to let ride to potential wave B target of 590
- IF the near term bullish scenario plays out and those calls print I’ll be watching for price to drop below 507 and look to enter July 450 puts to play the drop to projected wave C in the lower 400s
- Love this company, love how the LRCX calls and puts move. Ton of doe to be made leveraging these swings!!
Sincerely,
Severus Snape


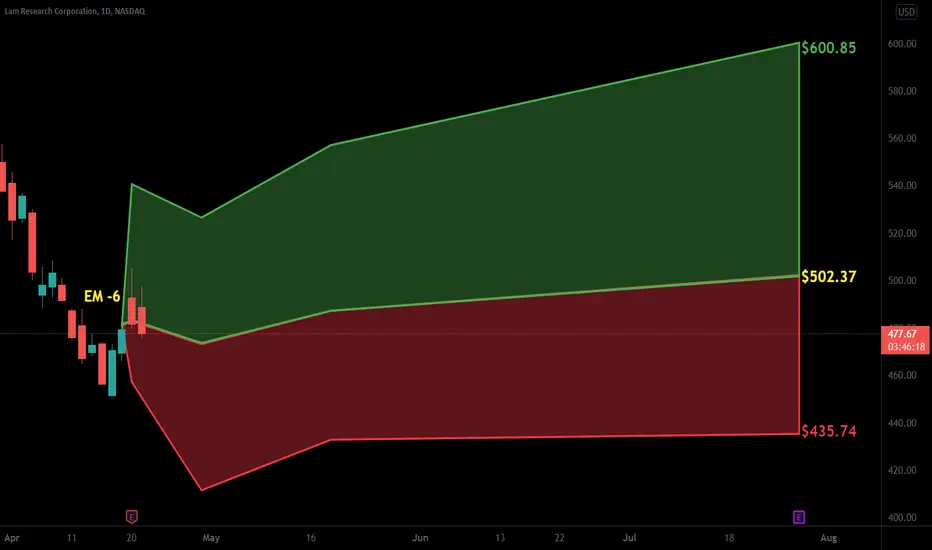
$LRCX with a Bullish outlook following its earnings #Stocks The PEAD projected a Bullish outlook for $LRCX after a Negative over reaction following its earnings release placing the stock in drift C with an expected accuracy of 33.33%.
LRCX Sitting on a very important fibDrew this out from 1990 lows and it is looking like if it breaks that price point we are looking out for new lows.


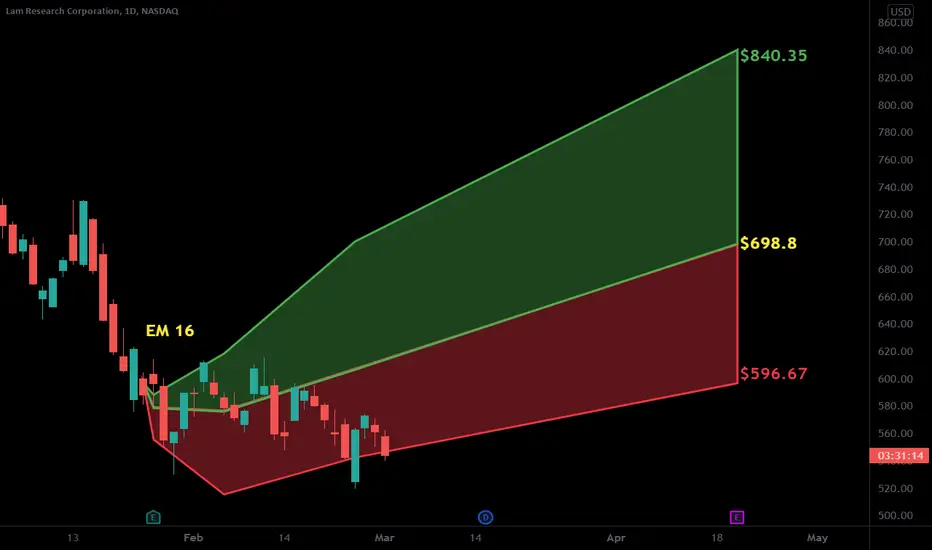
$LRCX with a Bullish outlook following its earnings #Stocks The PEAD projected a Bullish outlook for $LRCX after a Negative Under reaction following its earnings release placing the stock in drift D.


LRCX: The RIPPER Maybe the easiest name to play this week. I'm still salty I sold my 680c we bought for $5 for a measly $11. It ultimately went to $54.
A daily close over that ATH and we see 740 and 765 into earnings.
Using 714 as local support to short if it can't get over ATH as it ran out of juice Friday after a 50 point day.
One of my favorites and looking at LRCX $1000 to print this year as I stated in my year end analysis.

LRCX: Is $1000 in the cards in 2022? Alpha Traders members banked hard on LRCX for the last 2 months. Can it continue? A rest day is in order, but if through 707 ATH aren't far away. If it can work through the overhead supply it may be a 1000 name in 2022.

LRCX: THE NEXT FACE RIPPER LRCX is your next chip rip. Creating huge demand and should dip back to 600 before continuing its trip. Over 627.76 has a big day to 640.47 ahead of it soon. Over that $660 area. Ultimate target is $717. Yes you can quote me. December 31 target for that number.

LRCX: THE NEXT FACE RIPPER NVDA money to QCOM, LRCX, AMAT seems to be the trend here. LRCX is primed fora move to 717 in the next 30 days. We are layered long. It won't be straight up, but it will be such a fun ride.

Lam Research - Solid Company! Whats your thought?NASDAQ:LRCX
More consolidation before breaking out??

LRCX LONG SETUP There are two specific wolfe wave setups on the 78 min (AH+ON) and Daily time-frames. The projected target is calculated by extending a linear line between pivot 1 and 4 and projecting the line. This is represented as the green and blue perforated lines, as shown in the chart. The projected targets for the 78 min and daily setups are 378 and 605,respectively.
