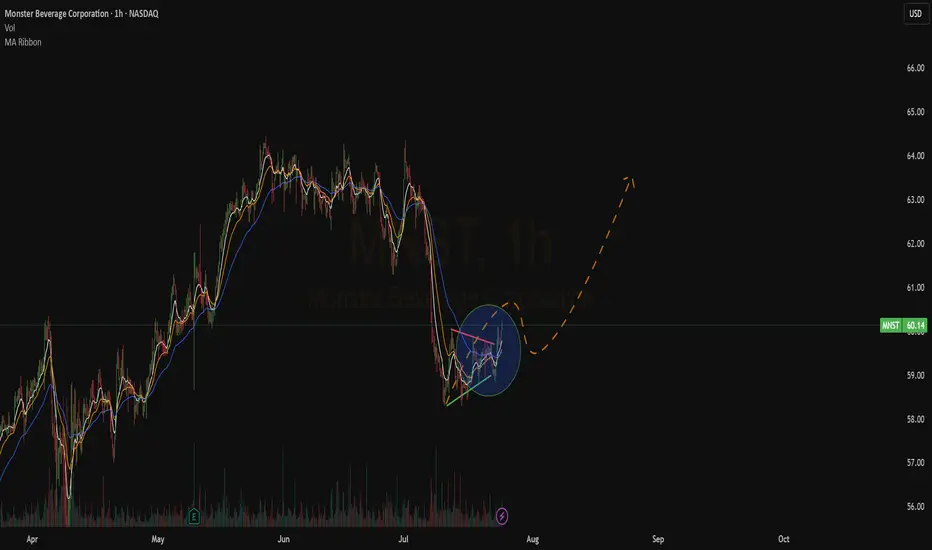
Quick View : MNSTThe hourly chart sees a very interesting Price-Action with the help of our Bullish ATR Breakout.
Bullish Crossover is confirmed, there is a huge space for a move upside
Ready To Catch It
MOB trade ideas
Monster Beverage: Breakout and PullbackMonster Beverage broke out to a new all-time high in May, and now it’s pulled back.
The first pattern on today’s chart is the March 2024 high of $61.23. The maker of energy drinks hesitated at that level in early May but pulled back to hold it last week. Has old resistance become new support?
Second, MNST is trying to stabilize at its rising 50-day simple moving average. That may reflect a bullish intermediate-term trend.
Third, the most recent dip pulled stochastics into oversold territory.
Finally, bullish price action after the last two earnings reports may reflect positive sentiment.
Check out TradingView's The Leap competition sponsored by TradeStation.
TradeStation has, for decades, advanced the trading industry, providing access to stocks, options and futures. If you're born to trade, we could be for you. See our Overview for more.
Past performance, whether actual or indicated by historical tests of strategies, is no guarantee of future performance or success. There is a possibility that you may sustain a loss equal to or greater than your entire investment regardless of which asset class you trade (equities, options or futures); therefore, you should not invest or risk money that you cannot afford to lose. Online trading is not suitable for all investors. View the document titled Characteristics and Risks of Standardized Options at www.TradeStation.com . Before trading any asset class, customers must read the relevant risk disclosure statements on www.TradeStation.com . System access and trade placement and execution may be delayed or fail due to market volatility and volume, quote delays, system and software errors, Internet traffic, outages and other factors.
Securities and futures trading is offered to self-directed customers by TradeStation Securities, Inc., a broker-dealer registered with the Securities and Exchange Commission and a futures commission merchant licensed with the Commodity Futures Trading Commission). TradeStation Securities is a member of the Financial Industry Regulatory Authority, the National Futures Association, and a number of exchanges.
TradeStation Securities, Inc. and TradeStation Technologies, Inc. are each wholly owned subsidiaries of TradeStation Group, Inc., both operating, and providing products and services, under the TradeStation brand and trademark. When applying for, or purchasing, accounts, subscriptions, products and services, it is important that you know which company you will be dealing with. Visit www.TradeStation.com for further important information explaining what this means.

Monster Beverage: A Rally Built on Solid Ground?Monster Beverage recently achieved a significant milestone, reaching a new record high after a multi-week rally. This ascent, surpassing its previous peak, indicates robust market confidence. While the proximity of an earnings report may have initially fueled anticipation, the sustained upward movement suggests that investors are reacting to more fundamental strengths within the company.
A primary driver behind this rally is the increasingly positive sentiment from financial analysts, evidenced by multiple upward revisions to price targets. Complementing this is strong support from institutional investors, who collectively own a majority of the stock and have been actively increasing their holdings. This significant institutional accumulation provides a solid foundation and reflects conviction in Monster's future prospects.
The company's operational performance, particularly the resilience and international growth of its core energy drink segment, underpins investor optimism, effectively counteracting challenges in other areas like the alcohol market. Furthermore, Monster's aggressive share buyback program signals management's confidence and enhances shareholder value. These combined factors – external validation, institutional backing, operational strength, and capital returns – appear to be the key forces propelling Monster Beverage shares to new heights, despite some market headwinds.

Monster Beverage Corp (MNST) – Energizing Global GrowthCompany Snapshot:
Monster NASDAQ:MNST continues to dominate the $60B+ global energy drink market, expanding across 159 countries with a diverse portfolio and strong executive leadership.
Key Catalysts:
Global Market Expansion 🌐
Strategic brands like Predator and Fury targeting emerging markets
New geographies = incremental revenue & brand exposure
Category Leadership & Diversification 🥤
Strong lineup: Monster Energy®, Reign®, Bang®, Java Monster®, NOS®
Broad consumer appeal → fuels market share gains in both premium & value tiers
Industry Tailwinds 📊
Energy drink market projected to grow at 7.6% CAGR (2025–2029)
Monster well-positioned with affordable, recognizable, and global brands
Leadership & ESG Strength 💼💚
Longtime Co-CEOs Rodney Sacks & Hilton Schlosberg driving global strategy
Involvement in charitable events reinforces brand goodwill and consumer trust
Investment Outlook:
✅ Bullish Above: $50.00–$51.00
🚀 Upside Target: $75.00–$76.00
📈 Growth Drivers: Emerging market expansion, brand strength, leadership, and rising category demand
⚡️ Monster – Powering growth from the shelf to the streets. #MNST #EnergyDrinks #GlobalLeader

There is a DraughtIt is due to the window that has opened yesterday. It shall get closed unless the market will get a cold.

Correction Has BegunWe have done the correction of the rise since August.
But this shall not mean a renewal uf the rise. Instead we have to look at the weekly chart to see that we have just corrected this retracement as well.
Thus I assume that we are still within a longer downward correction that begun in December and has still sufficient space to fill on the downside.

MONSTER Stock Chart Fibonacci Analysis 021125Trading Idea
1) Find a FIBO slingshot
2) Check FIBO 61.80% level
3) Entry Point > 46.3/61.80%
Chart time frame: B
A) 15 min(1W-3M)
B) 1 hr(3M-6M)
C) 4 hr(6M-1year)
D) 1 day(1-3years)
Stock progress: C
A) Keep rising over 61.80% resistance
B) 61.80% resistance
C) 61.80% support
D) Hit the bottom
E) Hit the top
Stocks rise as they rise from support and fall from resistance. Our goal is to find a low support point and enter. It can be referred to as buying at the pullback point. The pullback point can be found with a Fibonacci extension of 61.80%. This is a step to find entry level. 1) Find a triangle (Fibonacci Speed Fan Line) that connects the high (resistance) and low (support) points of the stock in progress, where it is continuously expressed as a Slingshot, 2) and create a Fibonacci extension level for the first rising wave from the start point of slingshot pattern.
When the current price goes over 61.80% level , that can be a good entry point, especially if the SMA 100 and 200 curves are gathered together at 61.80%, it is a very good entry point.
As a great help, tradingview provides these Fibonacci speed fan lines and extension levels with ease. So if you use the Fibonacci fan line, the extension level, and the SMA 100/200 curve well, you can find an entry point for the stock market. At least you have to enter at this low point to avoid trading failure, and if you are skilled at entering this low point, with fibonacci6180 technique, your reading skill to chart will be greatly improved.
If you want to do day trading, please set the time frame to 5 minutes or 15 minutes, and you will see many of the low point of rising stocks.
If want to prefer long term range trading, you can set the time frame to 1 hr or 1 day.

MNST to $50My trading plan is very simple.
I buy or sell when price tags the top or bottom of parallel channels.
I confirm when price hits Fibonacci levels.
So...
Here's why I'm picking this symbol to do the thing.
Price in channel zones
Stochastic Momentum Index (SMI) at oversold level
VBSM is spiked negative and under bottom of Bollinger Band
Entry at $46.72
Target is $50 or channel top

Important Support and Resistance Area: 50.93-52.95
Hello, traders.
If you "Follow", you can always get new information quickly.
Please click "Boost" as well.
Have a nice day today.
-------------------------------------
(MNST 1W chart)
If it falls from the HA-High indicator and meets the HA-Low indicator, it can be interpreted that the wave has been initialized.
If it falls below the HA-Low indicator, it is likely to show a stepwise downtrend.
However, since it meets the HA-Low indicator, it will eventually form a bottom area.
Therefore, the 50.93-52.95 area is an important support and resistance area.
-
(1D chart)
If possible, the point to watch is whether it can be supported around 51.92-52.95 and rise above 53.77.
If it falls below 50.93, you should check whether it is supported around 48.80.
If it is supported around 53.77, you should check whether it is resisted around 55.32-55.96.
-
Thank you for reading to the end.
I hope you have a successful trade.
--------------------------------------------------

$MSNT, Bullish channelNASDAQ:MNST is moving above the ema 21w with a rising channel. Higher highs, higher lows.
This last test on the ema 21w together with a possible bearish crossover on lower emas is extremely interesting for a continuation of this trend

MNST - MONSTER BUYING IDEA LONG
Dear traders,
Id like to share this idea in order to take long positions, basically the price looking for a previous support zone (around 45), max drawdown has been nearly 26% in this year (above to average amax rawdown).
45$ is is a good price to look for buying opportunities.
More aggressive opportunity would be nearly 35 but it is very unlikely.
Additionally mcde it is in an interesting zone to find buying signals.
best,

Its a buy for MNSTIts a buy for MNST - Can do a buy call. Price has reached a pullback zone and according to my analysis based on Price Action Manipulation, it is due for a rise in price


Bullish strategie for MIST StockMonster Beverage (MNST, $50.15) was a top loser over the last three months, falling -15.3% to $50.15 per share. A.I.dvisor analyzed 41 stocks in the Beverages: Non-Alcoholic Industry for the 3-month period ending June 25, 2024, and found that 26 of them (63.64%) exhibited an Uptrend while 15 of them (36.36%) demonstrated a Downtrend.
MNST in upward trend: price expected to rise as it breaks its lower Bollinger Band on June 12, 2024
MNST may jump back above the lower band and head toward the middle band. Traders may consider buying the stock or exploring call options. In 26 of 36 cases where MNST's price broke its lower Bollinger Band, its price rose further in the following month. The odds of a continued upward trend are 72%.

Best Deal I've seen all year $Mnst #monster Ask yourself will americans and europeans stop drinking the number 1 drug... Caffeine! No. Currently 20% discounted. This is the only good deal I've seen all year. I've loaded up all the way down this discount trend.

Monster is waking up? Daily RSI Divergence and Heavy volumeHave taken a position here. This can be a stock to hold.
The classic indicators says so, plus we have profitable company.
Lets see.
- Heavy volume on weekly and daily.
- OBV on daily and Volume.
- RSI Divergence on Daily.
- Falling wedge on daily.
- Growing earnings and revenue.
- bullish daily candle closing at the high.
And we have a recent price target to $68 USD.
www.tradingview.com

Monster Beverages - Bullish divergence in placeNASDAQ:MNST
Selling has been halted for Monster Beverages after bearish exhaustion was seen on 30th May. Thereafter, the stock saw a bullish divergence on the RSI, and volume has spiked. As such, we are entering buy at spot at 52.20 or waiting for a pullback to the 50.43 demand zone. Target could see beyond 60.00 in the midterm

Double your money?This is nicely shaping up to go parabolic soon. It could double from here. If it goes below 51 then its more bearish than bullish. It may stay above 52. Happy trading !!

$MNST long off POC and AVWAPLong MNST off likely support by POC and AVWAP.
Entry: $55.75
Risk options:
SL under previous low $54.75: Risk = $1.00 ($55.75 - %54.75)
SL under Low Volume Node (LVN) $53.45: Risk = $2.30
Tp at Value Area High $60.42
R:R ratio
1:4.7 or 1:2
($1 / $4.67 or $2.30 / $4.67)
Position Size:
'R' x Account_Size / Risk
Where 'R' is the percent of your account you are willing to lose (typically <2%)
Account_Size is your total risk capital
Risk is either $1.00 or $2.30 depending where you put the SL
Ex. If you are risking 2% per trade, your risk capital is $10,000 and you put the SL under previous low:
Position Size= 2% x $10,000 / $1.00 = 200 Shares
(or 87 shares with the SL under the LVN)

Monster: Sell SignalSince our last analysis of Monster, we've observed a significant rise to just over $60. However, we now believe that Wave B has concluded. There's a scenario where we could climb higher, but we don't subscribe to that view. We suspect a double top formation near the $60.50 mark, corresponding to the Wave I cycle, and anticipate a five-wave downward structure leading to Wave C or the overarching Wave (A). We're setting a short entry because we believe the structure allows for the assumption of a double top formation. Given this is a double top, we also expect to see a double bottom. Nonetheless, our target remains the upper end of the support zone, as we don't want to quibble over a few percentage points and risk not triggering our take profit. Therefore, we've set our target at $49.88.

MONSTER PUMP VIRAL MONDAY ! REDDIT! pump! monday only! biden ONW Biden is with us watch out he loves my grandma !
BIDEN WILL PUMP MONSTER WATCH REDDIT VIRAL!!!
BIDEN ONLY DRINKS MONSTER PUMP!!! MARKETS MONDAY! asap all WATCH LONGS ONLY !

MNST, Uptrend based on AlgoSignal StrategyThe current point exhibits promising upward signals according to my algorithmic system, meeting various criteria. These include rising trading volume, an upward trend indicated by prices above EMA20 and EMA50, and the closing price surpassing VWAP. As a result, the present conditions suggest a potential upward trend.

The Beverage Breakdown: Monster's Technical Tale Told.The Beverage Breakdown: Monster's Technical Tale Told.
Monster Beverage Corporation
1. Price Formation: The price has previously broken out from a Reverse inverted Cup &Handle price formation on a daily chart and hit a target. Bearish sentiment.
2. Moving Averages: The 7-day moving average (MA) is below the 21-day MA.
3. 200-day Moving Average is above the Price.
5. Relative Strength Index (RSI): The RSI is < than 50.
6. Price Target:35
Monster Beverage Corporation is an American beverage company that produces energy drinks, soft drinks, and natural beverages. As of my last update in January 2022, here’s a brief overview:
1. History
Monster Beverage Corporation was originally a natural beverage company called Hansen's, which was founded in 1935. They sold fruit juices, sodas, and other natural beverages for many years. In 2002, the company introduced the Monster Energy drink, which became extremely popular and led to a major shift in the company's focus towards energy drinks. In 2012, the company changed its name from Hansen's Natural to Monster Beverage Corporation to better reflect its primary product.
2. Products
Monster's most popular product line is its range of energy drinks, which include:
- Monster Energy (Original)
- Monster Ultra (Zero-calorie versions)
- Java Monster (Coffee-flavored)
- Monster Rehab (Tea-based)
- Hydro Monster (Non-carbonated, electrolyte beverage)
...and many other variants.
The company has also ventured into other drink categories and has collaborations with other brands and celebrities.
3. Acquisition by Coca-Cola
In 2015, The Coca-Cola Company and Monster Beverage Corporation announced a partnership where Coca-Cola transferred its energy drink business to Monster, and Monster transferred its non-energy drink business to Coca-Cola. Coca-Cola also acquired a significant minority stake in Monster as a part of this deal. This partnership helped Monster expand its global distribution significantly, as it could now leverage Coca-Cola's expansive distribution network.
4. Controversies:
Like many energy drink companies, Monster has faced criticism and legal challenges related to the health effects and marketing of its products, especially towards young consumers.
5. Financials and Stock Market Performance:
Monster Beverage Corporation is a publicly-traded company, and its stock performance and financials can be found on financial platforms or its official investor relations website.
Two key figures in the company's history are:
1. Rodney C. Sacks: He has been the Chairman and CEO of Monster Beverage Corporation for several decades. Sacks, along with Hilton Schlosberg, acquired Hansen's Natural (the predecessor to Monster Beverage Corporation) in 1992. Under their leadership, the company transitioned from selling natural sodas to launching the Monster Energy drink in 2002, which ultimately led to substantial growth.
2. Hilton Schlosberg: He has been the Vice Chairman, President, COO, and CFO of the company. Like Sacks, Schlosberg played an integral role in the transformation and success of Monster Beverage Corporation.
Both Sacks and Schlosberg have been instrumental in guiding the company's strategy, growth, and expansion over the years.
Rodney C. Sacks and Hilton Schlosberg, the key figures behind Monster Beverage Corporation's rise, both originally come from South Africa. They migrated to the United States, where they eventually took over Hansen's Natural and transformed it into the energy drink giant known as Monster Beverage Corporation. Their South African background and their success in the American beverage industry make their story quite notable in the world of business.
