MOB trade ideas

A MONSTER trade - Don't Hold Til Expiration!In this video I present a cautionary tale from trading history to show why it is a very bad idea from a risk management standpoint to hold options until expiration. This example comes from NASDAQ:MNST in 2014 when NYSE:KO made a surprise announcement that led to a huge move in the stock.

ABC BullishLooks like MNST missed earnings on 5/6, missing on EPS . Gpped down on earnings, then ,made a decent run up, followed by a substantial pull back. UMMMM
Rather deep pull back in past week or 2 of trading and is closing back in on C. I am watching as this one as the pull back is a bit deep. In an ABC bullish pattern , a tad under C can make a good stop. I do see a level of support not far under current price. If it holds and forms a consolidation zone here, I am in. Otherwise I will see what happens at the next support level .
The bullish Belthold is a fairly consistent candle for marking possible bullish reversals after a pull back or at the bottom. It is a one candle pattern. Look for a green candle, the bigger the better, with little or no lower shadow that closes (the top of the green candle) near the high. There will usually be a top wick, but it should not be a super long top wick. The top wick is marking the high for that session, and this candle is not valid if the close is way below the high of the session.
No recommendation

Bullish on MNST(This is not financial advice)
Nice pullback here on MNST, I am very bullish on consumer staples going into the next week. Low risk of this stock continuing to fall and a solid Risk vs Reward at 1.57.
- Vlaire

Monster Energy (MNST) Bearish ABCD Monster Energy is an odd company, because when was the last time you saw a Monster Energy commercial? probably not at all or it was a really long time ago, now when i ask the same of its Austrian competitor Red Bull probably more recent depending on your preferred media choice. Now, when I say energy drink what comes to mind? Either the Red Bull can or the distinctive Monster "M". This is what Warren Buffet calls owning a share of the consumers mind.
Coca-Cola (KO), Keurig/ Dr. Pepper/ Snapple (KDP), Pepsi (PEP) have tried to de-throne Monster (MNST) several times with Venom Energy, AMP energy, and Full throttle. Now KO is trying again with their own line of Coke Energy Drinks and I just don't see it doing too well but I could be totally wrong. Monster for the Value investor is a A++ buy. i don't typically give out an A++ buy, because the company usually starts faltering either on the income statement, balance sheet, or the cash flow statement. When I have friends give me company ideas to look at i usually don't make it past the Revenue line on the income statement which is usually my starting point.
The only companies that have received an A are Nike (NKE) and The Home Depot. The Home Depot is the only company that received an A+, until NOW! Monster would Receive an A++ grade but there is a down side, they do not pay a dividend, whereas, HD pays out a 2% dividend. Nevertheless, onward with the fundamental analysis.
When you look at the Financials you will see that MNST has been steadily growing its revenue over the past decade even in the full swing of COVID-19. I guess people need to make sure they were awake during the S*** Show called COVID-19. We are talking about a decade average of 13% increase, and no there are no huge "BOOMS and BUSTS" this is a steady increase floating between 9-13% a year with a steady Gross Profit Margin throughout the entire decade with the Average being 57%!!! Their SGA expenses compared to their Gross Profit is far below normal for any company of its size. This company provides energy drinks across the US and in 2015 they teamed up with KO and started using their distribution network to begin pushing their products outside the US. Their EPS has been steady growing with a few boom and busts in this area but overall a 20% increase.
Those are just a few highlights from the financials.
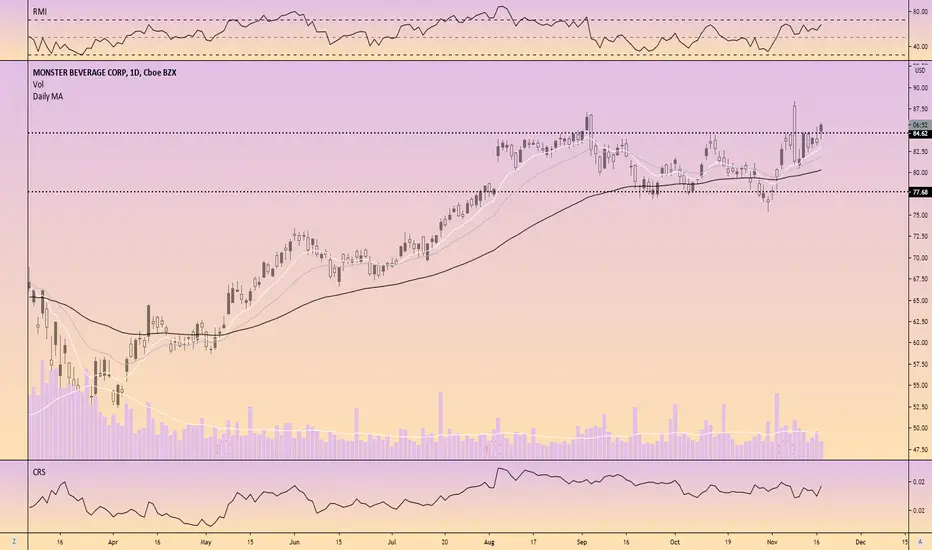
Now, on to the technical side of things... What you see on the chart is a Bearish ABCD pattern. price overextended a little bit and is now making its way down. Monster is trading too high at the current moment, and yes this is a bearish pattern i am using it as a guide to where to get in at the best current bargain. There are two yellow lines on the chart. One is a 382 retracement of the entire pattern and the other is a 618 retracement of the entire pattern. so, again these yellow lines are potential entry points
the orange line is the DJIA and we can see that MNST is out performing the DJIA! :) overall this is a great company to invest in!


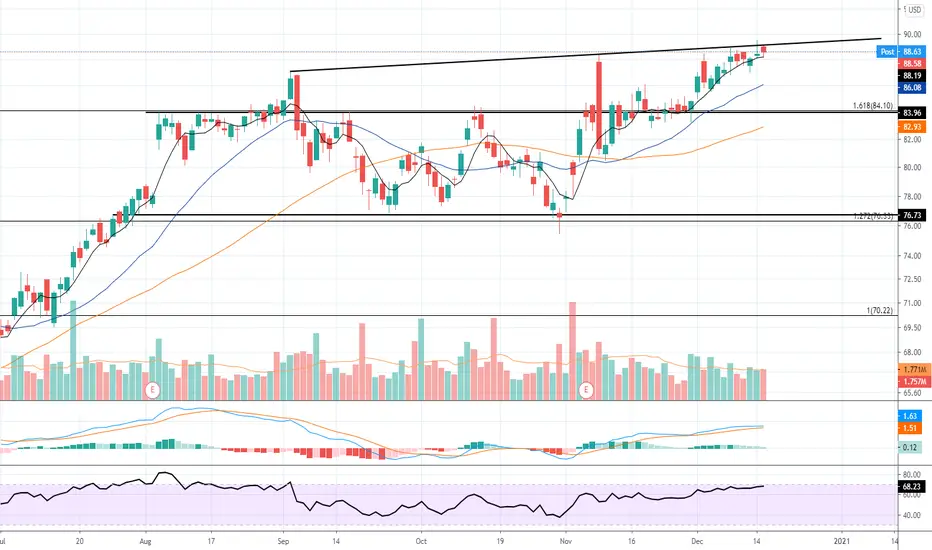
MNST. Round bases - round faces:)Looks like it forming another one rounded base if it is, than possible upward move brake out and possible retest (pullback).
Not a recommendation, just an observation.


MONSTER BEVERAGE 1D BULL FLAGBull Flag is a Range pattern that is a repeatable trading chart patterns.
Bull Flag chart patterns will have a directional bias (Short) depending on the previous incoming trend.
Each chart pattern will have defining trendlines of the support/resistance levels creating the pattern.
What ever time frame you are trading this chart pattern, wait for a candle close outside of the trendline in the direction of the breakout candle. (Our time frame preference is the Daily chart).
Add volume indicator - Volume is the amount of $ that went into a particular candle or in Forex the # of trades that took place.
Add ATR indicator - Volatility is the amount of price movement that occurred. Use the ATR to measure the price movement.
When you see descending Volume bars and descending ATR line (which indicates volatility) this shows
a dis-interest in traders to invest in this pair creating consolidation which creates the chart pattern.
Trade Management after there is a breakout candle close.
1 - Position size (compare volume bar to volume ma line).
a - Breakout candle must be 100% of volume average for a full position size.
b - If 75% of volume average then ½ position size. (To find 75% of Volume
look at the charts volume settings – divide smaller # into larger # = 75%+)
If not 75% then stand aside from the trade.
2 – If candle breaks out of a trendline, 15m before the close of the day prepare your buy/sell order.
Enter two trades. 1st trade will have a SL & TP. It will close automatically when the 1st TP is hit. 2nd
trade only has a SL and will be allowed to run. When 1st TP is hit move the SL to breakeven. Look
at ATR and prepare SL at 1.5 of ATR. Prepare 1st trade TP at 1 of ATR.
3 - SL for both trades will be 1.5 x ATR.
4 - 1st trade TP will be 1 x ATR.
5 - No TP on 2nd trade – letting profit run and adjusting SL to follow price.
6 - When 1st TP hit – move 2nd trade SL to breakeven.
7 - Adjust the 2nd trade SL to follow price.
*8 – After Breakout candle – if price closes back into chart pattern close trade don't wait for SL to be hit.
*9 - When breakout candle is more than 1 ATR from breakout candle open.
a - Enter 1st trade at candle close with ½ position size.
b - Enter 2nd trade with a pending limit order that is 1 ATR of breakout candle open.
c – Price should pullback to that pending limit order for 2nd trade.
d – If Price returns back into chart pattern close trade before SL is hit.

MNSTIchimoku cross, positive trend possible
2021 could bring a CBD product if the FDA relaxes restrictions.

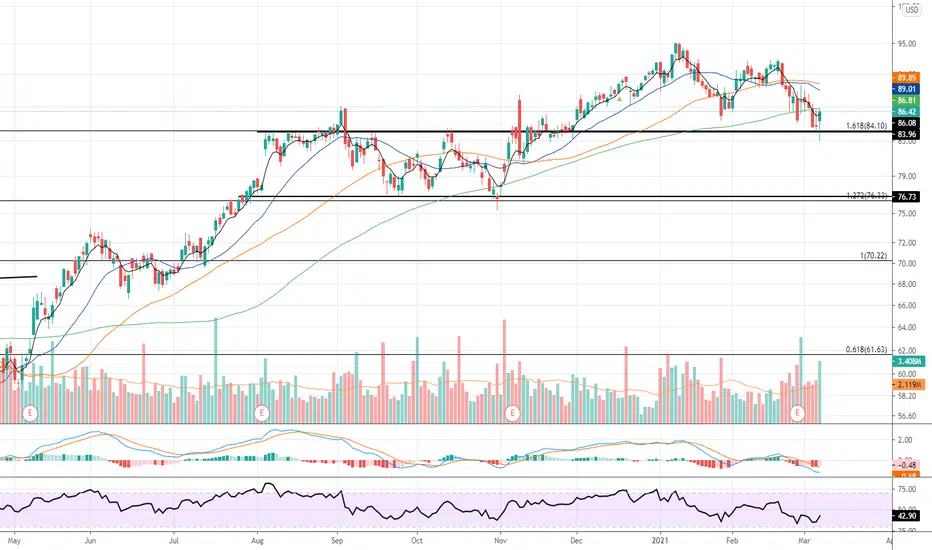
$MNST | Descending Channel: Watch For A Breakout [Update 1] $MNST formed a bullish descending channel.
Watch for a breakout of structure to the upside.
Let me know what you think in the comments and leave a like if you agree with my analysis! 👍🏽
See my previous $MNST analysis here:

$MNST | Falling Wedge: Watch For A Breakout$MNST completed a falling wedge at structure support. Watch for continuation to the upside. Good luck!

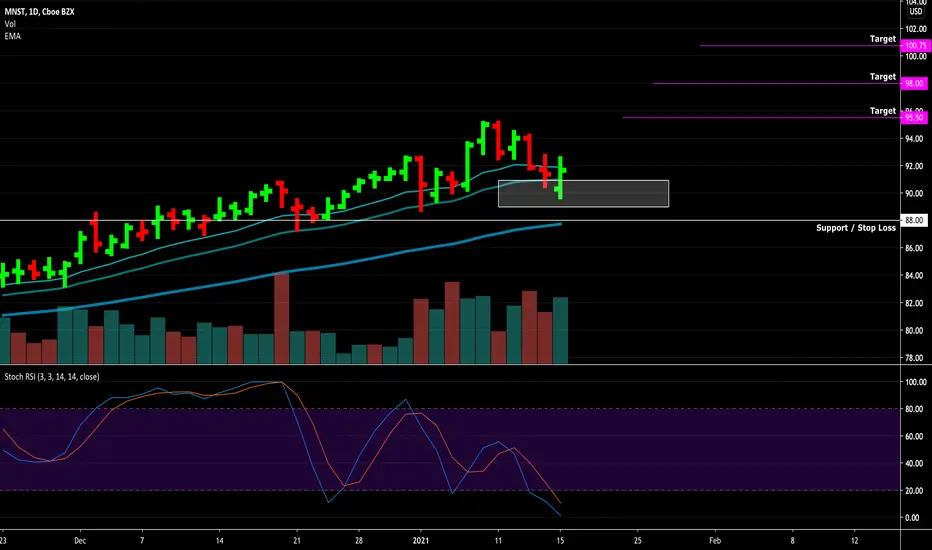
SUNDAY OPTIONS WATCHLIST 12/6/2020Keeping this set up on watch. Heavy resistance near 88 with those upper shadows but a nice strong up trend since last earnings. Could be a great breakout play if we continue to squeeze up to resistance. Will be watching for continued support at uptrend for possible entry.


$MNST here$MNST setup here is just beautiful
cant wait to see what she does here
dont mind me just charting enjoy:)

$MNST looking good hereLooks like $MSNT can retest white bar (DEMAND LINE)
Dont mind me just charting:)

MNST Long Set upJust broke out of triangle pattern, High volume supports the breakout. Indicators are supporting the move too. I think it will move higher. No fundamental analysis done but technically stock looks ready for move north.This post is for educational purposes only. Pleas do your own homework before buying or selling any financial assets.
