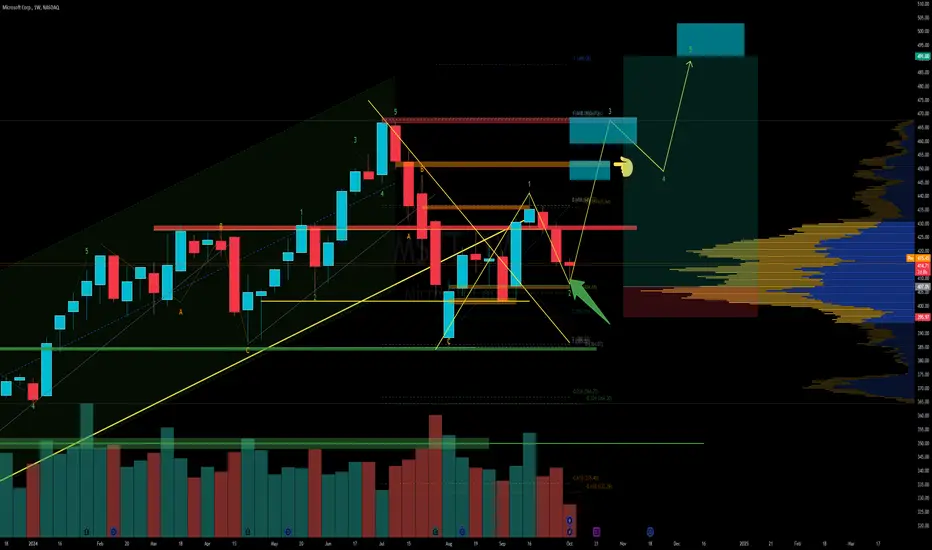
Microsoft AI targeting $456 as Innovation Drives GrowthI made the post again because I didn't like how the chart looked.
Microsoft is gaining bullish momentum, with a gap forming around the $422 level. A breakout above the $441.85 resistance would confirm further upward movement, setting the stage for the stock to test the $468 weekly resistance. With a solid 5.05 risk-to-reward ratio, this setup offers a compelling opportunity for traders, while managing risk with a stop-loss at $416.
Microsoft’s fundamentals continue to support its growth. Its dominant position in cloud computing through Azure, expansion in artificial intelligence with Copilot, and strong performance in enterprise software have solidified its role as a market leader. As demand for AI and cloud services grows, Microsoft’s diversified revenue streams position it well for sustained upside.
With technical and fundamental strength behind it, MSFT appears primed to reach the $456 level and beyond in the near term.
NASDAQ:MSFT
MSF trade ideas

Microsoft AI targeting $456 as Innovation Drives GrowthMicrosoft is gaining bullish momentum, with a gap forming around the $422 level. A breakout above the $441.85 resistance would confirm further upward movement, setting the stage for the stock to test the $468 weekly resistance. With a solid 5.05 risk-to-reward ratio, this setup offers a compelling opportunity for traders, while managing risk with a stop-loss at $416.
Microsoft’s fundamentals continue to support its growth. Its dominant position in cloud computing through Azure, expansion in artificial intelligence with Copilot, and strong performance in enterprise software have solidified its role as a market leader. As demand for AI and cloud services grows, Microsoft’s diversified revenue streams position it well for sustained upside.
With technical and fundamental strength behind it, MSFT appears primed to reach the $456 level and beyond in the near term.
NASDAQ:MSFT

MSFT - stock bouncing off trendline supportMSFT - Stock bouncing off trendline support with momentum on the daily time frame. Nvidia Joins Big Tech Hyperscalers At HLTH Conference, Partners With Microsoft To Drive AI Innovations. Stock has next resistance on trendline at $450. Calls above $430 looking good here.
MSFT long @ 417.13 for a quick bumpIt's oversold (according to my algo so please don't waste your time with telling me it's nowhere near oversold). It's in what I'd call a consolidation phase after more than doubling in the last 22 months. Unless there is a total macro meltdown, I don't see it having any good reason to (at worst) fall below the August 395 level and to do so would require to to breach the blue trend line as well as support from the early September low. I just don't see that happening soon.
That said, I'm a short term trader and with it being oversold, Im looking for a quick move higher in the next few days. Nothing amazing, I don't think, but enough to make me a quick buck or two. Maybe testing that upper blue resistance line.
Longer term, I'd give MSFT "core holding" status alongside NVDA as a major player in AI. NVDA from the hardware side, but MSFT in what I think will turn out to be the more lucrative side - applications. MSFT has a nearly endless number of potential applications for AI and are investing heavily in it, for both themselves and to provide services for customers down the road.
I'd get bearish if it broke down below 395, but if that happens, I really think there will be nowhere to hide in the market. Obviously if it breaks the upper blue resistance line, I see 465-470 ATH as its next test. I think short term it tests the blue support trend line and bounces. That's what I'm here for.

Microsoft Corp Hello,
A quick look with the Adaptive Trend Finder indicator on the Microsoft stock, with a daily chart.
I have set the medium-term and short-term settings.
We can see that the price is working at the bottom of the channel, so watch it.
The medium-term trend is bullish.
Make your own opinion before placing an order.
► Thank you for boosting, commenting, subscribing!

HIGH TIME FRAME STRATEGY. Use linear regression candles with support & resistance. (BUY/SELL indicator
on Linear Regression lags cross of CCI 100 to downside and CCI -100 cross to upside
as entering and exiting signal.)
Set SLO STOCHASTIC LINE AT 94 and 6.
Set CCI LINE AT 100 and -100. (Default)
CHOOSE A STOCK AFTER REVIEWING FUNDAMENTALS AND READING A FEW ANALYSTS REVIEWS.
START WITH MONTHLY TIME FRAME USING SLO STOCHASTIC. THEN WORK YOUR WAY DOWN TO LOWER TIME FRAME OF YOUR CHOOSING ALSO USING SLO STOCHASTIC.
SELECT YOUR TIME FRAME USING SLO STOCHASTIC FOR YOUR POSITION TIMING.
SLO STOCHASTIC UNDER 6 OR OVER 94.
SLO STOCASTIC IS VERY IMPORTANT
1) USE SLO stochastic with over 94 as overbought and under 6 as oversold lines. Slo stochastics is great at picking TOPS AND BOTTOMS.
2) After 1) you can enter trade using cross of CCI -100 to upside (long) or cross of CCI 100 to
downside (short).
3) For confidence in your position you can use RVI and ZERO lag MACD.
4) Use RSI stochastic oscillator with divergences while in trade. The 50 line will confirm
whether trend is getting stronger or weaker.
GOOD LUCK !

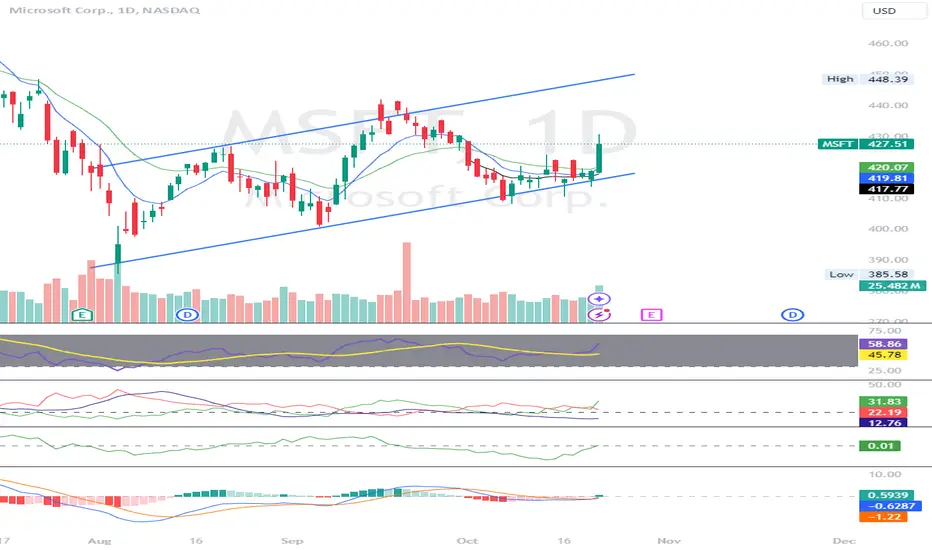
MSFT Trade ideaNASDAQ:MSFT broke the entry level briefly but couldn't hold. Possible retest into the GAP. Then look for bounce. Calls Can work if this goes above 420.38$ level. However, if this breaks down 416.60 level, can go to $413 level.
****NOT A FINANCIAL ADVICE****

MSFT Long IntradayAsset Class: Stocks
Income Type: Daily
Symbol: MSFT
Trade Type: Long
Trends:
Short Term: Up
Long Term: Down
Set-Up Parameters:
Entry: 416.74
Stop: 413.37
TP 423.47 (2:1)
Trade idea:
Waiting for a retest of the 15Min demand zone formed by Drop -base-rally at the channel breakout,
!!Be aware of pending Economic Reports. If price is within 20 pips of proximal value at time of major impact report, then Confirmation entry.
Trade management:
**When price hits 1:1 or T1, consider moving stop to entry in case of pullback.
**Disclaimer**:
The trading strategies, ideas, and information shared are for educational and informational purposes only. They do not constitute financial advice or a recommendation to buy or sell any securities, currencies, or financial instruments. You should do your own research or consult with a licensed financial advisor before making any trading decisions. The author assumes no responsibility for any losses incurred from following these trading ideas.

Microsoft sharp entry is active let's gooI believe you still have a chance to position yourselfs for better return,risking management is money n patience you got nothing to loose but 99% to make all the best n enjoy the signals.

MSFT Next 2 year run up?Last time MSFT has seen this monthly setup Microsoft ran 198% in 33 months. Microsoft has been consolidating for nearly 9 months. We have a Macd D that is curling down. but if we look back to Dec. of 2018 this same setup is happening today.

Msft educational I gave entry on Thursday for msft in H1 n H4 time frame this is D1 time frame is matching what we see in H1 n H4 soo what do we do when we see this we buy you also check how market is trending on the left the way it pull back n continuation of the trend,I want everyone to be profitable n take things easy n stop overthinking,even if you buy from this level n .market float to 380 to 350$.that doesn't mean it won't goo up that just mean a delay of the trend n a chance to enter more position low,what makes you loose money in the market is fear n back up of money,first you need money n scared to loose money,example if you have 100k n you take 10k to the risk n other have 1k n put 500$ into risk I can swear the 1k one won't be comfortable n can cut investment early but the 100k will be willing to sacrifice that 10k you know why,because he have enough back up to get bek in the game if things didn't goo the way he planned but this 1k have bigger problems n that 500$ is too much to loose he can't even afford to loose it too soo he must investment early. Take what small profit or small looses n 10k grow to another 100k,both have money but one terminated contract lols is very funny but reality.fear of what if what if is the one that makes or breaks a trader.

Msft H1 entryHi traders i decided to share with you entry for Microsoft IN H1 time frame am going to place some trades from this level with tight stop loss just lower the HEAD if you can, take smart n calculated first target 430.

MSFT - Time for long tradeMSFT is ready for a long trade here. This chart is parked right in between a bullish and bearish, a little confusing one. But I'm inclining towards long side unless rest of the market goes down.
Long - 408-415
Stop loss - 395
Target 1 - 450 - If this level breaks and holds, we've high chances of going up
Target 2 - 468
Target 3 - 492
MSFT Bounce at 100EMA with Bullish bar - Careful of Earnings Many people think earnings period for stock is not the time to trade. But what I learn is opposite... earnings with manipulation candlestick is very potent.... Lets put this theory to the test... Buying 99 Days calls with $3 as max loss ( nothing to worry about)

Is Microsoft Heading to 370?I'm seeing a potential bearish scenario shaping up for Microsoft (MSFT) based on what looks like a descending triangle pattern in the price chart.
Here's what I'm noticing:
Descending Triangle: The price action seems to be making lower highs, which forms that downward-sloping trendline. But at the bottom, there's a relatively flat support line. This kind of pattern often suggests that sellers are slowly starting to take control.
Possible Breakdown: If the price drops below that lower support line of the triangle, it could be a strong signal that the momentum is shifting downwards.
Price Target - 370: I think there's a chance we could see a significant drop to the 370 level. This is based on the pattern and the fact that there might be some strong selling pressure or negative news around Microsoft.
Of course, I need to be cautious:
Confirmation Needed: Just breaking below that support line isn't enough. I'll want to see increased volume during the breakdown to be more confident.
Risk Management: I know trading is always risky, so I'll make sure to use stop-loss orders to limit my potential losses if things don't go as expected.
Fundamentals Matter: I can't ignore the fundamental factors affecting Microsoft's price, like their earnings reports, what's happening in the tech industry, and the overall market conditions.
False Breakdowns Happen: Sometimes the price can break down and then quickly reverse. I'll need to watch closely and wait for confirmation before making any decisions.
It's important to remember that this is just my interpretation of the chart pattern, and I'm not giving financial advice. The actual price movement could be different. I'll definitely do my own research and maybe even talk to a financial advisor before making any investment decisions.

Microsoft Momentum: Riding the Tech WaveLETS GO! It doesn't get simpler than this. Price took liquidity off the lows, then it made a higher low followed by a higher high. What's next? you are right! another higher low followed by a higher high
Entry $415
Target high $460's
Stop $400

Potential long in $MSFT**Scenario:**
The 30-, 50-, and 200-day SMAs have been perfectly aligned for a bullish move for the past few days.
Since the low point in August, the price has been making higher highs and higher lows, indicating a bullish trend.
The seasonality in NASDAQ:MSFT (bullish Q4) is about to begin.
The last bullish wave has already been corrected by 50%, which may be sufficient for the next move.

Microsoft (MSFT) Shares Drop Over 3% This MonthMicrosoft (MSFT) Shares Drop Over 3% This Month
An overview of stock market charts since the beginning of the month reveals that while the Nasdaq 100 index (US Tech 100 mini on FXOpen) is in positive territory, Microsoft (MSFT) shares have underperformed significantly. The opening price on 1st October was $427.47, but by yesterday's close, it had fallen over 3%.
One of the key drivers behind this bearish sentiment is analysis from Oppenheimer, suggesting that Microsoft's financial performance may be negatively impacted by losses related to OpenAI. Additionally, Oppenheimer downgraded Microsoft's stock rating, a concerning sign ahead of the upcoming third-quarter earnings season.
Technical analysis of Microsoft's (MSFT) stock chart shows that the price is hovering around a critical support zone, which is formed by:
→ the lower boundary of an upward channel that has been in place since early 2024 (marked in blue);
→ the psychological level of $400 per share.
What could happen next?
Bullish outlook: Microsoft's (MSFT) share price may reverse upwards from this support zone. Yesterday’s bullish candle indicates a potential increase in demand.
Bearish outlook: The median line of the blue channel has acted as resistance (shown by the arrow). It’s possible that the next level where bears could confirm control is the former support at $425.
Which scenario plays out largely depends on Microsoft's upcoming earnings report, scheduled for 22nd October.
This article represents the opinion of the Companies operating under the FXOpen brand only. It is not to be construed as an offer, solicitation, or recommendation with respect to products and services provided by the Companies operating under the FXOpen brand, nor is it to be considered financial advice.

Have we neglected the US stocks when the limelight is on China ?MSFT is entering into a consolidation phase and the two blue lines are where I would like to accumulate more.
Please DYODD

MSFT ready for takeoffOn the daily timeframe, MSFT has bounced off a bullish fair value gap as well as a bullish breaker block. Also a bounce out the golden pocket.
This is a high probability setup for me.
Targeting 441.85.

Oct 8: MSFT ready to explode to the upsideAug 5 was an important low for tech stocks and many stocks in the market, as shown in the weekly RSI that the drop has corrected the whole rally from 2022.
Since then, MSFT has been going sideways in an ascending channel in two sets of 1-2 waves as shown in the 4 hour chart. This is typical for accumulation or basing before price acceleration in wave 3.
Great buy opportunity here.

Microsoft: Beginning of a Downtrend?
NASDAQ:AAPL
After a prolonged uptrend in Microsoft’s stock that lasted over a year, there are now some technical signals suggesting that this upward momentum might be reversing.
As shown in the image (attached), one of the key indicators of this potential shift is the moving average crossover. The 50-day moving average has crossed below the 200-day moving average. This pattern, often referred to as a “death cross”, is a classic technical sign that a stock may be entering a downtrend.
While this is by no means a guarantee, it’s a signal worth paying attention to, as it typically reflects a change in market sentiment. Combined with other potential indicators, this could be the beginning of a bearish phase for Microsoft.
What are your thoughts? Are we looking at a correction, or is this just a short-term blip?
Disclaimer: This post reflects my personal opinion and analysis. It is not financial advice. I am not responsible for any actions taken by others based on this information. Please do your own research before making any investment decisions.

