11/21/21 MUMicron Technology, Inc. ( NASDAQ:MU )
Sector: Electronic Technology (Semiconductors)
Current Price: $83.03
Breakout price trigger: $83.80
Buy Zone (Top/Bottom Range): $81.00-$78.00
Price Target: $89.00-$90.00 (1st), $95.00-$97.20 (2nd)
Estimated Duration to Target: 45-49d (1st), 60-64d (2nd)
Contract of Interest: $MU 12/17/21 82.5c, $MU 1/21/22 85c
Trade price as of publish date: $3.75/contract, $4.80/contract
MTE trade ideas

Micronback test on the move.......................................................................................

Micron (MU)Global growing trend and strong penetration of a local resistance trend line is a good signal for further growth of MU. Nearest resistance is $81 - upside ~ 8.5%. Stop limit is $70 (-4%). Profit/loss ratio is 2:1. Reaching first target recomend to close 70% of positon and hold other one to rqach $84, $88 and $94 closing 10% of initial volume every point.

Micron - Buy the LowWhile other semiconductor companies are rising (such as AMD & NVDA), Micron is dropping by a huge extent. Down from almost 100 to 70, I think it's a decent opportunity to buy low and be prepared to sell high. Purchasing from $70, and aiming for $81 - $83ish level for a profitable gain :D
- By Kujo Qtaro

this chart is beautiful😌very nice rally after a downtrend breakout here on MU ! today we are approaching a big resistance zones on the RSI and chart.
We can break resistance and continue a rally to all time high next week, but I think we will most likely see a few more weeks of consolidation first so the RSI can cool off.
please like and follow if you enjoy my analysis, thank you🚀

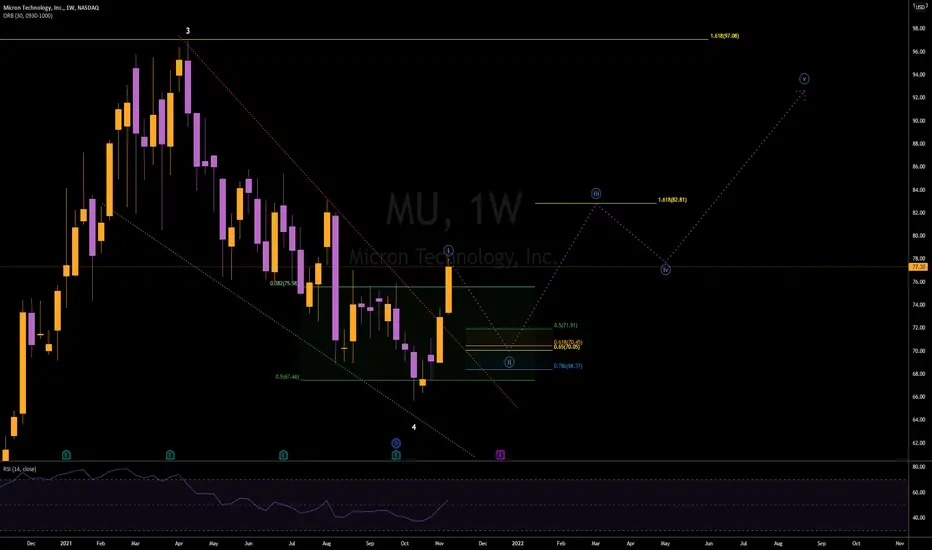
$MU | TRADE IDEAUpside looks limited from here. Expecting us to pullback into a corrective wave 2 into a very buyable dip around $70. Be patient on this one, it's only getting started.
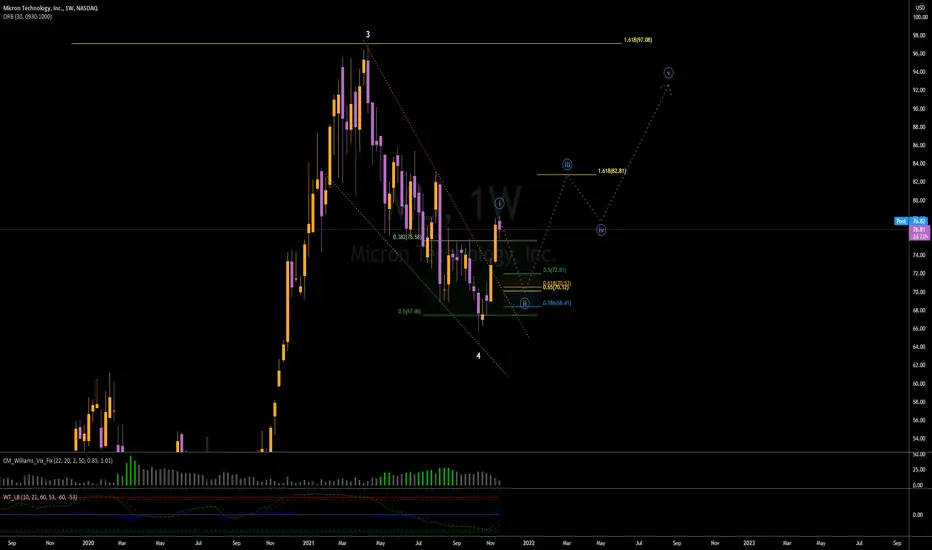
$MU | WEEKLY WATCHLIST 11/15 Not much has changed for me here. Still a very significant wedge breakout. However, I need to see a small wave 2 dip for me to buy into this for a swing. Staying patient on this one until risk/reward is in our favor.
MUMicron is a long based off the technical breakout on the weekly timeframe.
Targets lower 80 area and above there possibly 100.
Chips have been running like crazy, does it continue?
$UPWK $AAL $MU $UBER I OptionsSwing WatchlistUPWK 1W I UPWK massive ascending triangle on the weekly chart. After reporting earnings it came down to test our trend and this seems like a great entry to go long.
MU 1D I Micron is uniquely positions to speed up 5G across all parts of the spectrum. MU is currently breaking out from the bull flag we highlighted last week.
AAL 4H I AAL is showing us another entry to go long here. Setting a stop below $19.50. Looks like $20 will hold and it would be great to start seeing higher lows.
UBER 2H I UBER retested the breakout from the bullflag and it is now making a double bottom near $43. We have resistance near $46 and $48, and support near $44.

$MU - still running ALL DIPS A BUYI expected us to already see a flush , but it doesn't look like that is going to happen unless serious market weakness. This thing is looking to make a move to 90 soon. ALL DIPS ARE A BUY


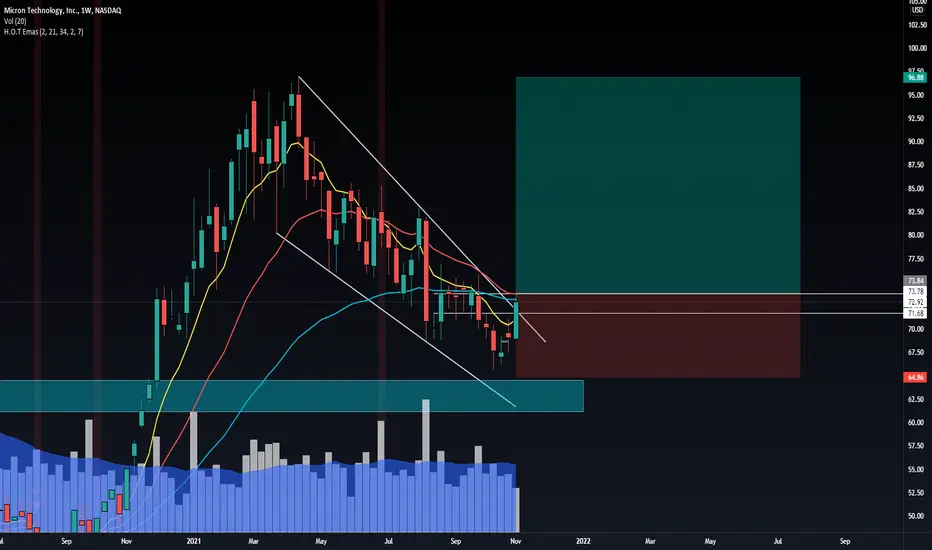
After 200 days we can see a breakout | MUToday we will take a look at Micron Technology, a company that engages in the provision of innovative memory and storage solutions. Time to check the Technical elements on the chart:
1) From 2018 until November 2020 the price was inside a massive range until we saw the breakout of it and a 50% bullish movement from that situation towards the top of the bullish impulse
2) From April until today the price has been consolidating on a clear corrective pattern where we can define both top and bottom edges
3) How can we know that the structure is finished? Two reasons here: first we have clear edges (previous item) and second the structure has made contact with a key level, in this case, the ascending trendline.
4) Now we have a breakout of the corrective pattern. Remember that Technical Analysis is a statistical discipline, which means that we are never gonna have certainty about a situation. However, we know that if we engage in quality situations over certain periods, we will be able to observe consistent results.
5) We are not taking setup on this stock, (we already have exposure on other assets). However, it's an interesting situation to wait for a throwback (retest of a broken structure). IF that happens, we have defined an activation level as you can see on the chart (ALWAYS ABOVE THE TRENDLINE)
6) Depending on how aggressive is the setup you are taking, the invalidation level can be: FIRST below the whole structure 65.00 / SECOND below the throwback (this setup provides a massive risk to reward ratio, however, is prone to a quick stop loss)
7) Targets: IF I would be executing a setup here, I would protect my setup once the price reaches the previous top, which shares a major resistance zone that you can see on the weekly chart (2% below that, I want to be risk-free) / Now, the places to close setups on profit can be the first or 2nd Fibonacci extension. The expected duration of a movement like this may be between 200 to 300 days.
8)RISK: This is the formula I use to trade: I never have more than 5 setups at the same time NEVER EVER. And the maximum % of risk I take on any setup is 3% (ONLY with a STRATEGY THAT YOU HAVE a lot of EXPERIENCE WITH). Let's understand this better, most of my setups happen on the daily chart, which means that time resolutions are between 2 weeks to 3 months. Another rule I use is that my setups must happen on uncorrelated assets example: NFLX / BTCUSD / XAUUSD / FCX / AMZN. So my worst-case scenario is losing all at the same time which means a -10% to -15%. That's more than acceptable for me. And the most probable thing is that I would be able to open 4 to 5 new setups 1 to 2 months later. That's why this type of trading style is so secure. Even in apocalyptic scenarios, you would face a manageable loss, and it will take you time to develop new setups (you avoid impulsive trading)
Thanks for reading! Please feel free to share any idea about MU, in terms of technical or fundamental analysis.

MU Correction unfoldingMicorn is unfolding into its correction.
Intersting to see if it unfolds into a flat or a zig zag (becauase was shifted to start of circle grey B on line chart

MU readyMassive weekly falling wedge breakout,
I am watching for an entry above last week's high.
Great R:R
mu buy cup and handle . we have an uptrend channel .. buy at 77.00 .. stoploss under the support level ..

$MU | UPDATEChart looking really good so far on this breakout! Waiting for a possible retest to get me into a long swing position. Being patient here and hoping it pays off.
MU descending channel breakoutBreakout of a descending channel. Technical analysis would indicate the potential of a breakout the height of the introductory move of the channel (see below). Resistance levels to watch (see eyes) are going to be the areas that the channel has rejected breakout in the past: 75 (which we may be done with now), 82, and 85. I would also watch the 78-79 level when it hits the anchored VWAP from this channel it just escaped.

$MU | WEEKLY WATCHLIST 11/8Monthly cup and handle forming, this is a long-term view. Nice falling wedge breakout looking for upside from here.

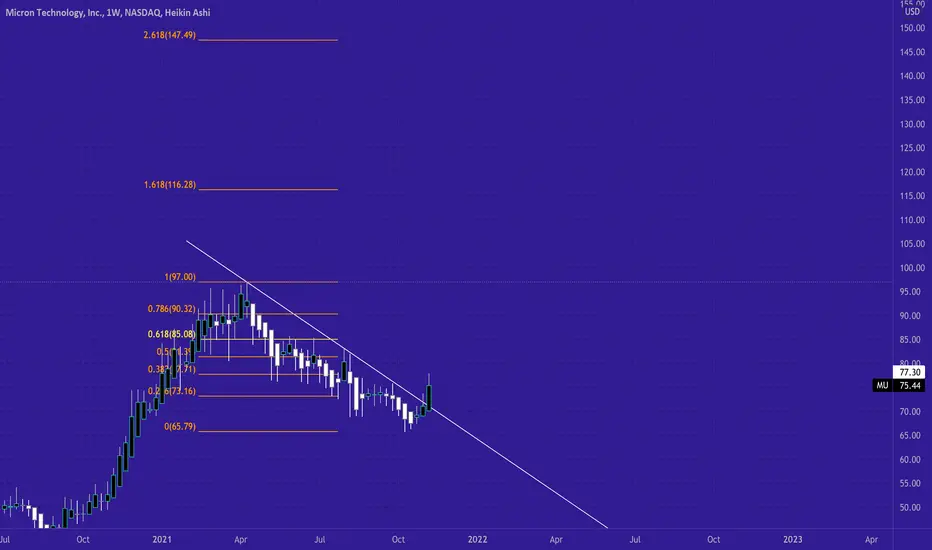
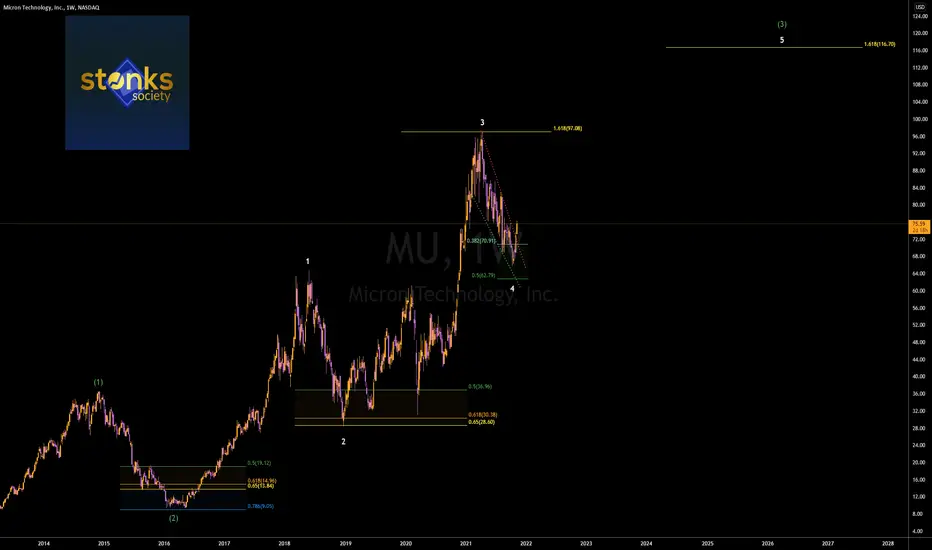
Breaking through the resistance line in Micron TechnologyMicron Technology is a semiconductor manufacturer. It is primarily known for its DRAM modules, flash memory and SSD drives.
The price broke through the resistance line. In fact, the 5th ascending wave has begun. Within the 5-wave movement, the price should reach at least the top of the third wave, which is about 30 percent from the current levels.
Micron Technology also shows good economic results. Revenue is growing from quarter to quarter. The consensus price from analysts is $98 (above the third wave).

$MU vs $AMD part 2*This is not financial advice, so trade at your own risks*
*My team digs deep and finds stocks that are expected to perform well based off multiple confluences*
*Experienced traders understand the uphill battle in timing the market, so instead my team focuses mainly on risk management*
My team has been covering $MU for the past few months. After consolidating in the $65-$75 range for the past couple of months we finally believe that $MU is ready to take its leap to go past $100.
$MU is a semiconductor company much like $AMD. With this being said investors should expect these two to uptrend similarly short-term along with other semiconductor companies this winter due to a chip production increase.
For long-term investors $AMD is the chip tyrant that will most likely dominate its competition, but that does not mean we can't still make money off $MU.
My team entered $MU at $72.92 per share at market-close on Friday. Our first take profit is set at $92 per share.
OUR ENTRY: $72.92
FIRST TAKE PROFIT: $92
2ND TAKE PROFIT: $103
If you want to see more, please like and follow us @SimplyShowMeTheMoney

MU ending wave 4, 5 on the wayI believe MU is starting it's fifth wave, joining other semiconductors stocks in the uptrend.
Please do your own research. This is not financial advice. For education purposes only.

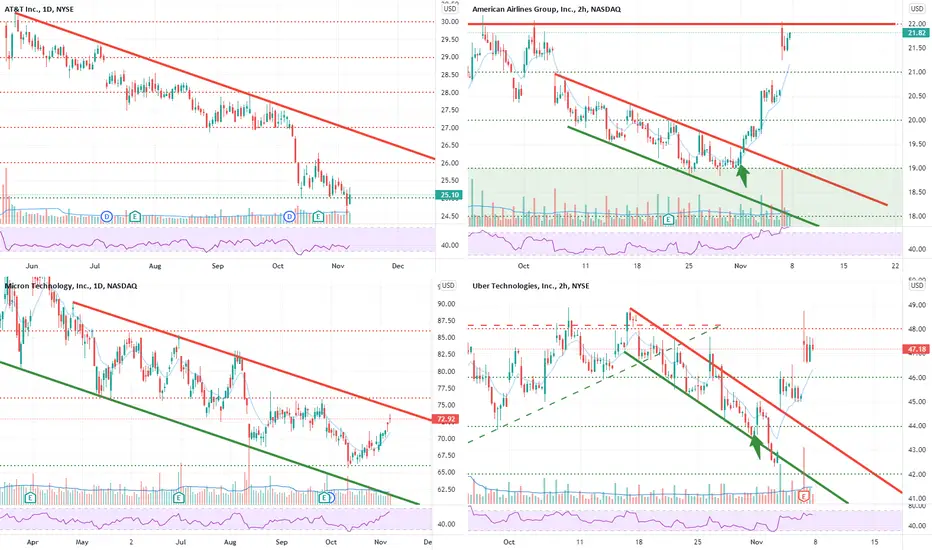
$T $AAL $MU $UBER I OptionsSwing WatchlistT 1D I T spent millions lobbying to get the infrastructure bill passed. It's network expansion plans will benefit from govt. subsidies. There is a bullish div on the RSI.
AAL 2H I AAL ended up breaking from our bull flag last week and made a 15%+ move from our entry, after finding support near $19. Expecting resistance on AAL near $22.
MU 1D I Micron is uniquely positions to speed up 5G across all parts of the spectrum. MU is currently testing the top of its bull flag. The stock average price target is $96.
UBER 2H I BUBER bounced right on our trend. After reporting earnings UBER ended up breaking out from the bull flag and making a 12%+ move from our entry.