This may look like a repost of yesterday's idea - it's not.As tempting as it was today to choose TSLA and profit from the middle school girl drama that is Elon and DJT today, I’ll wait until the dust settles on that one to profit from it. Yes, the chart here for CME looks almost identical to the one for TW in the idea I posted yesterday. Hopefully, the outcome will be the same.
CME's performance with my algo has been stellar historically, and with a chart like this, it shouldn't be surprising. Its returns have been eerily similar as well. Overall, it has a 682-1 record with my algo (per usual, the 1 is from a signal yesterday). Average gain is 1.33% and the average holding period here is 17 days. Not quite 2x the average daily return in the market. Not huge, but very reliable.
So, long at 274.90 is the call here. Maybe FPC close, maybe not. The results above are based on FPC, however.
As always - this is intended as "edutainment" and my perspective on what I am or would be doing, not a recommendation for you to buy or sell. Act accordingly and invest at your own risk. DYOR and only make investments that make good financial sense for you in your current situation.
MX4A trade ideas

CME eyes on $225: Major front with only scattered clouds above CME has been struggling up against a major resistance zone.
Golden Genesis plus Golden Cofid fibs in a tight confluence.
Break should run given only minor fibs for some distance above.
$ 225.53 - 226.56 is the immediate zone of interest.
$ 218.47 below is first support for SL protection.
$ 239.66 is first hurdle and should be easy target.
========================================================

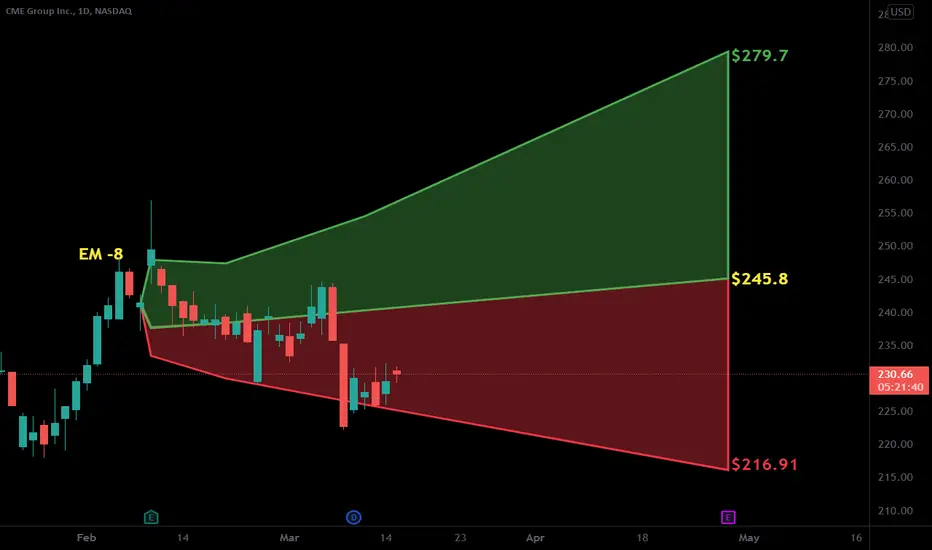
$CME with a bullish outlook following its earnings #StocksThe PEAD projected a bullish outlook for NASDAQ:CME after a negative over reaction following its earnings release placing the stock in drift C with an expected accuracy of 80%.

CME to $209MODs have suggested that I provide more detail about the picks I make.
Sorry. I'm not as verbose as y'all, and I don't like things to be complicated.
My trading system is very simple.
I buy or sell at top & bottom of parallel channels.
I confirm when price hits Fibonacci levels.
Bonus if a TTM Squeeze in in play.
I hold until target is reached or end of year, when I can book a loss.
So...
Here's why I'm picking this symbol to do the thing.
Price at top channel
Stochastic Momentum Index (SMI) at overbought level
Price at Fibonacci level
In at $218.62.
Pullback target 208.67 (1.618 fib ext)

CME 1H Long Swing Aggressive CounterTrend TradeAggressive CounterTrend Trade
- short impulse
+ biggest volume T1 level
+ biggest volume 2Sp-
+ weak test
+ first bullish bar closed entry
Calculated affordable stop limit
Takle profit:
+ 1/3 1 to 2 R/R
+ 1/3 to a Daily CREEK
+ 1/3 to a monthly 1/2
Daily Context
"- short balance
- unvolumed ICE level
+ support level
+ biggest volumed of the Day wave"
Monthly context
"+ long impulse
+ 1/2 correction
- volumed T2
+ support level
- unvolumed manipulation"

New Product Launch: How to Use TradingView OptionsWe’ve rolled out our newest product and we’re eager to brag about it! It’s an options platform — TradingView Options. More precisely, it’s a powerful set of tools for options traders who want to keep a close eye on every little detail and fine-tune their strategy to perfection.
What Are Options?
Options are financial derivatives that give the buyer the right, but not the obligation, to buy or sell the underlying asset at a set price within a set period.
TradingView Options
TradingView Options is designed to illuminate your options trading strategy from the first step to the last one. Get razor-sharp options strategies on gold futures ( COMEX-GC1! ), oil futures ( NYMEX-CL1! ), and many more.
Let’s break it down and discuss what it's about. For starters, you’ve got three key components — Strategy Builder, Options Chain, and Volatility Analysis.
1. Strategy Builder
Create, test and visualize options strategies with real-time data.
Use pre-built strategies filtered by bullish, bearish, or neutral outlooks.
Customize strategies with adjustable parameters like expiration dates and strike prices.
Get estimates for max profit, max loss, win rate, and more.
Compare multiple strategies on a single chart for performance analysis.
2. Options Chain
Options chains are broken down into two sections — calls and puts.
Strike price is displayed in the center column — it’s where the put or call can be exercised.
Next to Strike is IV, %, which stands for Implied Volatility in percentages.
Measure options risk with the Greeks: Delta, Gamma, Theta, Vega, and Rho.
Easily switch underlying assets with a simple symbol search at the top left.
3. Volatility
Analyze market volatility to understand potential price movements and risks.
Market Coverage
Currently, TradingView Options supports options contracts from major exchanges including CME and its subsidiaries NYMEX, COMEX, and CBOT, alongside NSE , and BSE .
Conclusion
The new options trading tools by TradingView empower traders with the data and analytical capabilities needed to whip up high-probability strategies and explore new opportunities for profit in global markets.
Are you an options trader? What’s your trading style? Let us know in the comments!

Strong Momentum - 230 Initial TargetCME has a bullish setup that I've traded with success numerous times in the past. It repeats this pattern a lot.
Buy Zone = 217 - 221 (current level); Breakout level = 222
- Initial Target = 230 by 3/15/2024
- Then expect pullback to test 222-224 for support
- After that it will make a final leg higher to end this wave around 240-250 in April-May 2024.
CME is correlated with crypto moves but not dependent on them, so current BTC/ETH rally helps here, but doesn't really matter the CME setup drives itself.

CME Entry, Volume, Target, Stop
Entry: with price above 221.77
Volume: with volume greater than 1.77M
Target: 230.73 area. This is an area, you might consider existing early if price drops below a significant moving average such as the 10, 20, or 50 EMA. You might also considering holding some portion of the trade longer as price closes above significant moving averages.
Stop: Depending on your risk tolerance; Based on an entry of 221.77, 218.78 gets you 3/1 Reward to Risk Ratio.
For a higher risk and higher reward trade, enter when price breaks above 217.90 (high from Nov 13) and set your stop below the entry day or day before entry day candle, or wherever your normal risk tolerance allows.
This LONG swing trade idea is not trade advice and is strictly based on my ideas and technical analysis. No due diligence or fundamental analysis was performed while evaluating this trade idea. Do not take this trade based on my idea, do not follow anyone blindly, do your own analysis and due diligence. I am not a professional trader.

Pro Trader Patterns for Swing TradingThis important exchange has been doing very well with options and futures contract sales.
NASDAQ:CME had a classic pre-earnings run up fueled by professional traders swing trading, out of a platform support level.
The retracement was only a sympathy move with retail knee-jerk reactions due to the fear around the stock market at this time, not an indication of the company's earnings report or growth potential.
The stock is not at its all-time high level yet, so it can run further before slamming into strong resistance.
On the monthly chart, it has a Double Trough on DPO, which is a strong indication for the stock's long-term cycle.

CME Long Good Risk reward to a good company
SL pink line. Blue green TP at 2/3 and let 1/3 run
Insider bought around this price
Date Filed Reporting Name Relationship Trans. Date Shares Price $ Total Value $
29 Mar 2023 SHEPARD WILLIAM R Director 28 Mar 2023 195 186.45 36,337
29 Mar 2023 SHEPARD WILLIAM R Director 27 Mar 2023 298 185.32 55,194
29 Mar 2023 SHEPARD WILLIAM R Director 27 Mar 2023 13 185.32 2,433
20 Jan 2023 SHEPARD WILLIAM R Director 18 Jan 2023 55 175.98 9,651
20 Jan 2023 SHEPARD WILLIAM R Director 18 Jan 2023 1,244 175.98 218,905
20 Jan 2023 SHEPARD WILLIAM R Director 28 Dec 2022 13 168.11 2,145
20 Jan 2023 SHEPARD WILLIAM R Director 28 Dec 2022 289 168.11 48,646
05 Dec 2022 TIERNEY ROBERT J JR Director 02 Dec 2022 1,500 176.55 264,825
08 Nov 2022 SHEPARD WILLIAM R Director 04 Nov 2022 40,000 170.00 6,800,000
08 Nov 2022 SHEPARD WILLIAM R Director 04 Nov 2022 8,645 170.00 1,469,636
08 Nov 2021 DUFFY TERRENCE A Chairman and CEO 05 Nov 2021 400 222.02 88,806
05 Nov 2021 DUFFY TERRENCE A Chairman and CEO 04 Nov 2021 200 220.21 44,042
05 Nov 2021 DUFFY TERRENCE A Chairman and CEO 04 Nov 2021 100 220.21 22,021
05 Nov 2021 DUFFY TERRENCE A Chairman and CEO 04 Nov 2021 100 220.20 22,020
05 Nov 2021 DUFFY TERRENCE A Chairman and CEO 04 Nov 2021 300 220.21 66,062
05 Nov 2021 DUFFY TERRENCE A Chairman and CEO 04 Nov 2021 600 220.26 132,153
05 Nov 2021 DUFFY TERRENCE A Chairman and CEO 04 Nov 2021 300 220.13 66,039
12 Jun 2020 SHEPARD WILLIAM R Director 11 Jun 2020 1,229 178.10 218,885
04 Jun 2020 SHEPARD WILLIAM R Director 02 Jun 2020 771 178.10 137,315

Long-Term Investment Opportunity with Strong FundamentalStrong Financial Performance and a good Investment Opportunity!

CME: Might the rally continueA price action above 179.00 supports a bullish trend direction. It is also close to the 200-day simple moving average.
Further bullish confirmation for a break above 188.00.
The target price is set at 193.00.
The stop-loss price is set at 181.00.
A change in trend direction as highlighted by the MACD might acts as further support.

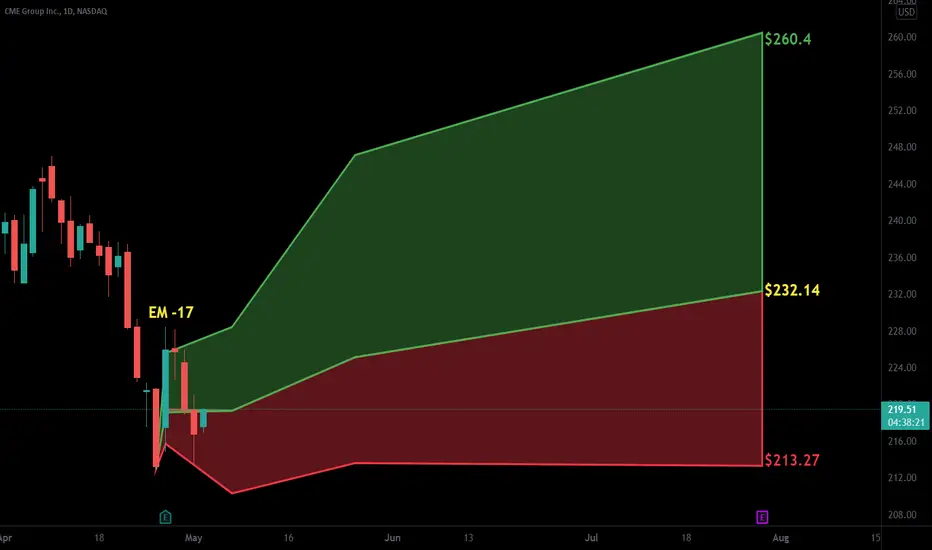
$CME with a bullish outlook following its earnings #StocksThe PEAD projected a bullish outlook for NASDAQ:CME after a negative under reaction following its earnings release placing the stock in drift D with an expected accuracy of 63.64%.

Waiting for the pull-back ... ⚡See chart. Horizontal consolidation was broken to the upside. Waiting for a pullback to the breakout level now. If you have any questions - feel free to use the comment section below ...

Pull Back FishingPrice is between the .618 and the .786 of the trend up.
Triangle forming.
Price is at the resistance line today.
Short interest is low at around 1%.
No recommendation.
ATH 256.94.
5 YEAR LOW 126.05.

CME weekly head and shouldersCME weekly head and shoulders once we retest the neck can short the heck out of it.

CME daily bullish hammer wave 3 of head and shoulders retracmentOrder BUY CME NASDAQ.NMS Stop 176.17 LMT 176.17 will be automatically canceled at 20230401 01:00:00 EST
CME daily bullish hammer wave 3 of head and shoulders retracment

$CME with a Bullish outlook following its earnings #Stocks The PEAD projected a Bullish outlook for $CME after a Negative Under reaction following its earnings release placing the stock in drift D with an expected accuracy of 60%.

CME - 200MA ContinuationCME can be seen to be poised above its major trend line ( in green )
Price has bounced nicely off the 200MA above this line also (blue)
Continuation up is likely as both these support areas are respected
Bullish rising wedge placed also on chart

$CME with a Bullish outlook following its earnings #Stocks The PEAD projected a Bullish outlook for $CME after a Positive Under reaction following its earnings release placing the stock in drift A with an expected accuracy of 80%.
The moon made a mistake
I hate being slapped left and right in the market, buying at the top of a range, selling at the bottom. I hate false breaks, I hate making the right moves but losing money up and down -- that can happen if I stop out on a bull weakness, chase higher on strength, and stop out on weakness, and the cycle continues. Even in the gold market's $20 range, I could lose $50, albeit in the right direction.
Concussion trend, can produce not only major loss, and also can blow trader's confidence. I have had many such experiences myself. Because before the emergence of big market, often will be the first violent shock, deliberately frighten traders, thereby missing the real good opportunity.
The biggest temptation after an early stop is to get back in before a strong signal. Once trapped in this cycle, trading discipline and patience will be tested.

WHEAT AND RELATED STOCKS WATCH TREND FOR CONTINUED HIGHER HIGHsnext 10 years all agriculture prices going up see the trend now buy in higher highs !! food scarce is real !!

$CME with a Bullish outlook following its earnings #Stocks The PEAD projected a Bullish outlook for $CME after a Positive over reaction following its earnings release placing the stock in drift B with an expected accuracy of 25%.