Keep an eye on the trendline!NIO is starting to poke its head above trend resistance, I'd like to see it cross 5.69 to confirm the downtrend breakout. if that can come then a rally to 9 can come soon. 15+ is very optimistic.
Boost and follow for more! 🔥chart request @unixro
N3IA trade ideas

$NIO You're updated roadmap for $NIOcopy & paste from twitter & stocktwits:
We have to see how it develops, but expecting to see an expanded flat with a 5 wave impulse to complete this sideways correction that started April 15, 2024 before we make the final move down to complete the macro structure and unfortunately filling gaps below....cont
The TVC:HSI & NYSE:BABA appear like they will make new lows over the next 24 mo. paying closer attention when new lows are made on TVC:HSI and around 12k. I thought we found the bottom going into March/April last year but wrong as this developed into a corrective flat for NYSE:NIO
lastly the volume profile isn't capturing the correct data - if we view only $66.99 to the current low, there is a massive volume gap at the ~0.382 fib correcting wave W (the 5-3-5 structure) at $11.02 which is the highest tgt for this bounce & HSI finishing correction from 2007

NIO long pivot for the record $NIOWXYXZ. Z = Y @ log .618
they wanted a longer description so.. long pivot on deck, bullish divergences multiple timeframes. I like to have fibs AND geometry supporting the count as shown on the chart but it lacks geometry. the 5-3-5 zz we want to see in wave Z is a harder sell but im running with this anyway. Weekly timeframe looks obvious but we can nit pick on tiny timeframes.

$NIO downtrend or recover?Looking at the daily chart, it's obvious that the 30/60 EMA crossover with downward movement likely confirms that the price hasn't finished dropping and is heading toward new lows. The decline began on 10/28/2024, and at some point, the price tried to pull out of its steep dive on 03/11/2025 - even showing some volume - but it was all in vain. After forming a cup pattern, the price never completed the handle formation and simply slid downward.
A couple of scenarios could play out from these lows: it might suddenly shoot upward, signaling that it won't return to the downtrend in the near future, or alternatively, it could continue "testing the bottom" and provide a good entry point below $2.38. The volumes of recent trading sessions add to this suspicion - it feels like deliberate selling pressure, or perhaps dumping based on fears about Trump's new tariffs.


NIO bottomed out or nothi traders,
Some time ago we shared the trading idea:
but this NIO set-up failed as the stop loss at 4,05 was reached.
Since then, NIO dropped 22%.
I see a potential that a local bottom is in as RSI hit oversold levels and the price is kind of respecting the downsloping channel.
I won't be calling any huge reversal yet because NIO has a lot to prove but expecting the bounce towards 4,90-5$ is reasonable here.
However, if the price drops and closes below 3,10$ , this set-up will be invalidated.

23R NIO LongExpecting a big move up in NIO to start happening imminently. I think it’s bottomed.
Have seen an ABC correction in support.
Trade rating 8/10
Risk to reward rating 9/10
Probability 7/10

Nio Will Go Long Be Patient Price needs a 4th touch of support. Patience will be key to this entry. Once confirmed with a lower timeframe I will update the trade. This will be a longterm hold.

NIO will follow BABA hi traders,
BABA has been pumping for the last few days.
NIO is a lagger and the price remains under the downsloping resistance line.
Once we get a successful breakout, expect the rocket to launch.
72% gains in the next weeks are very likely.
Don't miss it out!

NIO Charging UpNIO looking 🔥
Up up up — this weekly dip is a gift.
Strong support holding, volume picking up, and momentum building.
This is a textbook buy point on the weekly.
Charging up for the next run. ⚡️

Falling Wedge, a bullish caseMy previous analysis back on Nov 2024 hit its' target support around 3.70 and is currently proving to be a good support. Assuming this holds for the next few days, I would expect this to traverse within this falling wedge and should compress along. If it this upward and confirms, I'd expect resistance around5.54. If it continues, should have another resistance around 7.00.
I would watch to see what the indicators reveal as this progresses. But as it stands today, it may have found the floor.

$NIO Wyckoff Accumulation – Schematic #1 or #2 in PlayMy base case at the moment is Wyckoff Accumulation Schematic #2 , where the Secondary Test ( ST-B ) could mark the very bottom. This idea will be validated for me especially if we see interaction with the High Time Frame Channel projection.
Green Zone:
We have multiple levels of confluence around this zone:
0.786 Fibonacci Retracement from the 2020 low to the 2021 top
MO – Monthly Open level
Volume cluster from previous local consolidation
Blue Zone:
If price drops as low as VAL, I expect it to be just a quick, volatile wick breaching into the Blue Zone.
High Time Frame Channel projection:

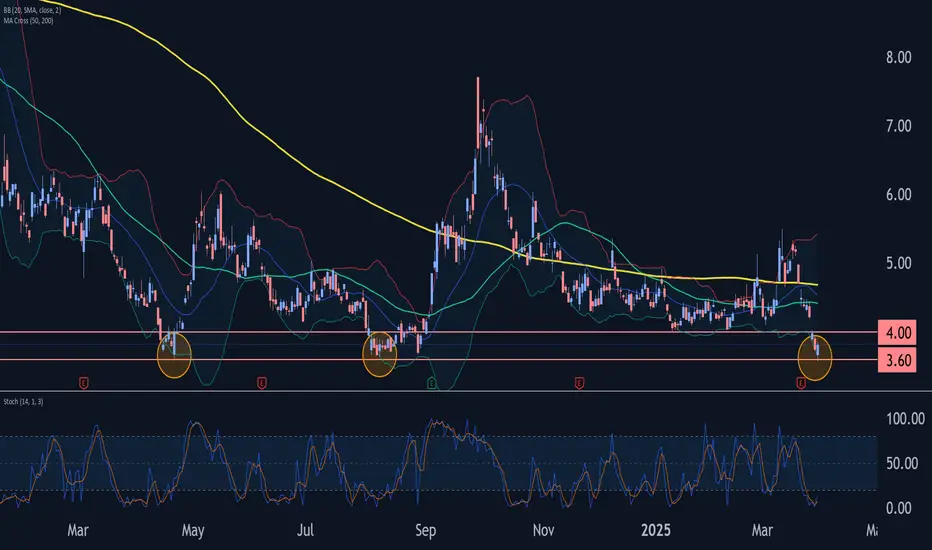
NIO Wave Analysis – 31 March 2025
- NIO reversed from support zone
- Likely to rise to resistance level 4.00
NIO recently reversed from the support area located between the multi-month support level 3.60 (which has been reversing the price from April of 2024) and the lower daily Bollinger Band.
The upward reversal from this support zone stopped the C-wave of the earlier intermediate impulse wave (B).
Given the strength of the support level 3.60 and the oversold daily Stochastic, NIO can be expected to rise to the next round resistance level 4.00 (former strong support from January).
Big Trend Reversal As seen in my previous post NIO has followed my prediction which was to draw back to the 3.60 price range and form a triple bottom, its final sale, in my opinion this is the best time to buy.
- A very strong triple bottom has formed.
- Low RSI on the1D indicates the stock is Oversold.
- Strong RSI divergence as seen with the blue arrows indicates a reversal.
I will be looking for a strong bounce off the 3.60 Price line followed by some consolidation to prepare for the uprise or vice versa (consolidation followed by a big jump, maybe a reverse head and shoulders formation in the near future).
This is not financial advice, but if you have been waiting for the best time to add shares/buy into NIO, I cannot imagine a better time to buy.
Seems that NIO is till somewhat respecting the large green trendline but has gapped below it, what do you guys think about that? Would love to hear your thoughts and feed back.

Nio Accumulation pattern Nio USD looks to be in an accumulation pattern. Jump over creek in play right now. Next HTF expectation mapped on chart.

NIO Stock Trades Below $5 Following Earnings ReportIn just three trading sessions, the stock of the Chinese electric vehicle company has dropped more than 14%, now hovering around $4.50 per share. The ongoing bearish move remains steady after the company reported a net loss of approximately $985 million and weaker-than-expected sales of $2.7 billion, compared to the $2.8 billion forecast. These disappointing results have fueled consistent selling pressure in recent hours.
New Lateral Range:
Recent price action has led to the formation of a sideways range, with resistance near $5.00 and support around $4.17. The recent bearish movement has pushed the stock to stabilize near the bottom half of this range, giving the current sideways formation more relevance, with no clear signs of a breakout in the short term.
MACD:
The MACD histogram continues to fluctuate near the neutral zero line, indicating that the average strength of recent moving averages is balanced, with no dominant directional bias in the short term. This suggests that the lateral formation may persist, keeping price movements neutral for now.
ADX:
However, it’s worth noting that the ADX line remains consistently above the 20 level, which may imply that recent price moves are gaining trend strength. If the ADX continues to rise above 20, this could reinforce the bearish momentum observed in recent sessions.
Key Levels:
$5.00 – Remains the most important resistance level , located at the top of the current range. Sustained moves above this level could mark the end of a long-term downtrend that has been in place since September 2024.
$4.53 – A key mid-range leve l, where the Ichimoku cloud and the 50- and 100-period moving averages converge. This may act as a neutral zone, where indecisive price action could continue, extending the current lateral formation.
$4.17 – Critical support level , aligned with the recent multi-month lows. A break below this level would signal a potential bearish breakout, possibly triggering a more aggressive downward trend in the short term.
By Julian Pineda, CFA – Market Analyst

Is $NIO ready to go up?Is NIO Ready to Go Up? Full Analysis & 5-Year Fair Value Projection
1. Technical Analysis:
• Moving Averages:
• 20-day EMA: $4.62
• 50-day EMA: $4.52
• Since NIO is trading above these levels (~$5.03), it suggests slight bullish momentum.
• However, a strong breakout requires a close above $6.00 (200-day EMA).
• RSI (Relative Strength Index): 57.65 (neutral).
• ADX (Trend Strength): 17.74, meaning weak trend.
• Support & Resistance Levels:
• Support: $4.00 – If NIO holds above this, it could stabilize.
• Resistance: $5.80 – If it breaks, an uptrend may start.
Conclusion:
• Short-term trend: Neutral to slightly bullish.
• Breakout needed above $6.00 to confirm an uptrend.
⸻
2. Fundamental Analysis:
• Revenue (2023): $7.6 billion, expected to reach ~$10 billion in 2025.
• Net Loss (2023): $2.4 billion, meaning not profitable yet.
• Gross Margin: ~5% (Tesla: 17-20%).
• Cash Reserves: $4.3 billion, but frequent share dilution is a risk.
• Expansion: Growing in Europe, but competition from Tesla, BYD, XPeng.
Conclusion:
• Growth potential exists, but profitability remains a challenge.
• Cash burn & dilution are key risks.
⸻
3. Macroeconomic & Industry Factors
• China’s EV Market: Largest in the world but highly competitive.
• US-China Relations: Potential trade barriers for Chinese EVs.
• Battery Prices: Stabilizing, but still impact profit margins.
Conclusion:
• Market competition & macroeconomic factors will play a big role in NIO’s future.
⸻
4. Competitive Landscape
• Tesla (TSLA): Strong margins & global leader.
• BYD: Biggest threat in China due to lower costs.
• XPeng & Li Auto: Direct competitors in premium EV space.
Conclusion:
• NIO is losing market share and needs stronger financials to compete.
⸻
5. Five-Year Fair Value Projection (2025-2030)
• Best-case scenario (Bullish) → $20-$30
• NIO achieves profitability & sales growth.
• Base-case scenario (Moderate) → $10-$15
• Lower losses but still struggles with competition.
• Worst-case scenario (Bearish) → $3-$5
• Cash burn continues, leading to share dilution & price stagnation.
Current Fair Value Estimate: $7-$10 (based on discounted cash flow models).
⸻
Final Verdict: Is NIO Ready to Go Up?
• Short-term: Needs to break $6.00 for bullish momentum.
• Long-term: High risk, high reward – profitability is key.
• Fair Value (2029-2030): $15-$25 if execution improves.
⸻
⚠️ Disclaimer:
This is not financial or investment advice. Investing in stocks, especially high-risk ones like NIO, carries significant risks. Always do your own research and consult a professional financial advisor before making any investment decisions.

NIO Options Ahead of EarningsIf you haven`t bought NIO before the previous earnings:
Now analyzing the options chain and the chart patterns of NIO prior to the earnings report this week,
I would consider purchasing the 6usd strike price Calls with
an expiration date of 2025-6-20,
for a premium of approximately $0.47.
If these options prove to be profitable prior to the earnings release, I would sell at least half of them.

NIO Share Price Soars by Approximately 17%NIO Share Price Soars by Approximately 17%
The stock chart of Chinese electric vehicle manufacturer NIO shows that its price has reached a new high for 2025, following a 10% surge yesterday.
In the process, the stock formed a wide bullish gap and successfully broke through the psychological $5 per share level.
Why Has NIO’s Share Price Risen?
The bullish sentiment is largely driven by anticipation of the company's upcoming earnings report. Last year, NIO achieved record-breaking monthly EV deliveries, reaching 31,000 units in December.
Investors are now eagerly awaiting further details about NIO’s two new mass-market brands, Onvo and Firefly. Onvo has already launched, while pre-orders for Firefly—a compact and intelligent EV priced at around $20,500—have begun.
Additionally, some investors may be shifting capital from TSLA shares (which have been experiencing a bearish trend, as reported yesterday) into NIO stock.
Technical Analysis of NIO’s Stock Chart
Looking at the bigger picture, NIO’s share price remains within a long-term downward trend (marked by the red descending channel). Since the start of 2025, the stock has fluctuated around the median line without dropping below $4 per share, a level where supply and demand have historically balanced out.
However, yesterday’s strong upward momentum suggests that the balance may have shifted in favour of the bulls. Given the positive fundamental outlook, buyers could maintain the recent gains, potentially pushing the share price towards the upper boundary of the red channel—following the trajectory outlined by the blue lines on the chart.
This article represents the opinion of the Companies operating under the FXOpen brand only. It is not to be construed as an offer, solicitation, or recommendation with respect to products and services provided by the Companies operating under the FXOpen brand, nor is it to be considered financial advice.

NIO - Earngins and FY2024 results, upside $6+XPEV has already given a hint and direction along with BABA plus China's stimulus. Also, thanks to Trump's tariffs, people bet on China.
NIO is going to post positive earnings and FY2024 results.
I expect the price to take a leap step towards $6 with a resistance of $7.29.
Split the trades as my entries are 4.5-5. Sell the resistance.

NIO | China will Lead the EV BattleNIO, Inc. is a holding company which engages in the design, manufacture, and sale of electric vehicles. Its products include the EP9 supercar and ES8 7-seater SUV. It provides users with home charging, power express valet services, and other power solutions including access to public charging, access to power mobile charging trucks, and battery swapping. It also offers other value-added services such as service package, battery payment arrangement, and vehicle financing and license plate registration. The company was founded by Bin Li and Li Hong Qin on November 28, 2014 and is headquartered in Jiading, China.

One last drop, one last sale. Dear NIO Investors, I Come with Good News.
Apologies if the chart looks busy, but to fully explain my perspective, I need to highlight key patterns: Head and Shoulders, Fibonacci levels, RSI divergence, and projected price paths.
We can all see the massive green trendline that NIO has respected for years. Recently, there was a brief fake breakout, signaling that market whales are actively watching this stock. This move likely triggered stop losses, shaking out weak hands and grabbing liquidity—classic whale behavior.
Now, the direction is becoming clearer. Alongside the RSI divergence (marked by blue arrows), which is a strong bullish signal, I believe NIO is setting up for a major move. However, before that happens, we may see one final dip, potentially forming a triple bottom near $3.69 before a strong reversal.
Technical Analysis:
🔹 Head and Shoulders:
Typically, the price moves nearly the same distance from the head to the neckline before completing the pattern. This suggests further downside is possible, but confirmation is key.
🔹 Fibonacci Retracement:
When all three key Fibonacci levels are broken, price often retests the original Fib start point. However, markets don’t always behave perfectly—whales may step in earlier if demand rises.
Key Takeaways:
📌 $3.69 is a potential target, not a guarantee. If too many traders expect that level, whales may buy slightly higher or lower.
📌 Volume and price action are crucial. If buyers step in before reaching $3.69, the reversal may start sooner.
📌 External market conditions (EV sector news, macroeconomics) could impact this setup. Watch for catalysts.
Final Thoughts:
I know it has been years since I last posted, but nothing seemed significant enough to update—until now.
🚀 My strategy:
Consider scaling in gradually rather than waiting for an exact price.
If NIO dips before the rally, watch for strong buyer reaction before entering more aggressively.
This is not financial advice, just my perspective based on the charts. Stay smart, and trade wisely.

$NIO yieahhI had to, really had to - do another post for $NIO. This time on the monthly logarithmic.
Love this structure on the monthly, 3M and 6M look GORGEOUS. That last word makes me worried a bit, this chart is just too good that makes it sketchy. But hey - I am still hyper bullish.
Ran a time mark from the gray vertical line to the blues. Started on the retest from Wave 1 as that retest looks pretty similar to what we just saw in Feb. This takes us to $25 by October which is an insane 5-6x in pure stock play. If we break the mid line we are off to the upper part of the channel.
Is this too good to be true? I don't know that's why I ask.
yieahhhh
