Nio long tradesimple price action with multiple confluences. Liquidity was collected from downside which was very much expected. Looks ready to test upper line of the wedge, take profit just below 89 period MA on daily chart.
N3IA trade ideas

NIO AnalysisPrice playing nicely as analyzed last week. Price showed signs of rejection from the POI at 7.90. No changes with my original expectations, I'm expecting price to continue higher after this bearish retracement, potentially into the bearish POI at 10.03.

NIO: Trading in a Dangerous Area; Watch Out For These Key Points• NIO is trying to reverse the trend on the 1h chart, as now it is above the 21 ema, which is ascending;
• What’s more, NIO just filled one of its gaps at $8.29, but it seems this area is acting as a resistance now;
• The problem is that we don’t see a clear bullish structure, like a higher high/low yet. This gives the impression that this was just a short-term rally, not a real bullish reversal;
• To make things worse, NIO is on the verge of losing its previous support line at $8.03, and this could completely frustrate this rally;
• Therefore, NIO must close above this key point today, in order to avoid a bearish continuation;
• On the other hand, it seems that the $8.29 is our key resistance, and only by breaking it, NIO would actually turn bullish again. In this case, it could fill all the previous gaps and hit the $9.47 again.
• On the daily chart we see that the 21 ema acted as a resistance, and NIO failed in breaking it. This 21 ema is at $8.33 right now, close to the $8.29 seen in the 1h chart, making this area a dual-resistance level;
• Therefore, it is crucial for NIO to break this resistance as soon as possible, in order to trigger a meaningful bullish pattern.
I’ll keep you updated on this. Remember to follow me to keep in touch with my daily analysis.

NIO REVERSES within descending parallel channelOn the 30-minute chart, I have drawn the upper (red) and lower (green) trendlines
of the descending parallel channel. While it had been riding the upper edge of
the Fibonacci/ EMA channel, it has reversed and headed toward the base EMA with
the candles green to red. The zero-lag MACD indicator lines crossed above the
histogram while the True Strength Index oscillator has had a line cross in the supply /
resistance zone for further information. I conclude it is time to close long positions
in profit and cross the aisle into short positions. I will take a put option trade for
the expirations of 5/19 @ $ 9.50 but a less risky trade would be a longer exiration
by 1-2 weeks ( while at the same time decreasing the reward potential.)

NIO SHORTstrategy short trend
NIO delivered 6,658 vehicles in April 2023, increasing by 31.2% year-over-year
NIO started the delivery ramp-up of the EC7 in late April 2023
NIO delivered 37,699 vehicles year-to-date in 2023, increasing by 22.2% year-over-year
Cumulative deliveries of NIO vehicles reached 327,255 as of April 30, 2023
SHANGHAI, China, May 01, 2023 (GLOBE NEWSWIRE via COMTEX) -- SHANGHAI, China, May 01, 2023 (GLOBE NEWSWIRE) -- NIO Inc. (NYSE: NIO; HKEX: 9866; SGX: NIO) ("NIO" or the "Company"), a pioneer and a leading company in the premium smart electric vehicle market, today announced its April 2023 delivery results.
NIO delivered 6,658 vehicles in April 2023, representing an increase of 31.2% year-over-year. The deliveries consisted of 1,713 premium smart electric SUVs, and 4,945 premium smart electric sedans. Cumulative deliveries of NIO vehicles reached 327,255 as of April 30, 2023.
In April 2023, the majority of deliveries were attributable to ET5 and ES7, while NIO has been upgrading its product offerings from NIO Technology 1.0 (NT1.0) to NIO Technology 2.0 (NT2.0).
In late April 2023, NIO started to steadily ramp up the production and delivery of the EC7, a five-seater smart electric flagship coupe SUV from NT2.0.
On April 18, 2023, NIO debuted the All-New ES6, a smart electric all-round SUV, at the Shanghai Auto Show. Derived from NT2.0, the All-New ES6 will bring user experiences beyond expectations in terms of design, performance, comfort, intelligence, safety, and sustainability. NIO expects to officially launch the All-New ES6 and commence deliveries in May 2023.
The All-New ES8, a smart electric flagship SUV based on NT2.0 that was launched at NIO Day 2022, is expected to commence deliveries in June 2023.
At the Shanghai Auto Show, NIO also launched the 2023 ET7, a smart electric flagship sedan based on NT2.0. The 2023 ET7 boasts more than 15 product upgrades, providing users with a more comfortable driving and riding experience, a more refined interior and a more intuitive digital experience. Deliveries of the 2023 ET7 will start in May 2023.
About NIO Inc.
NIO Inc. is a pioneer and a leading company in the premium smart electric vehicle market. Founded in November 2014, NIO's mission is to shape a joyful lifestyle. NIO aims to build a community starting with smart electric vehicles to share joy and grow together with users. NIO designs, develops, jointly manufactures and sells premium smart electric vehicles, driving innovations in next-generation technologies in autonomous driving, digital technologies, electric powertrains and batteries. NIO differentiates itself through its continuous technological breakthroughs and innovations, such as its industry-leading battery swapping technologies, Battery as a Service, or BaaS, as well as its proprietary autonomous driving technologies and Autonomous Driving as a Service, or ADaaS. NIO's product portfolio consists of the ES8, a six-seater smart electric flagship SUV, the ES7 (or the EL7), a mid-large five-seater smart electric SUV, the ES6, a five-seater all-round smart electric SUV, the EC7, a five-seater smart electric flagship coupe SUV, the EC6, a five-seater smart electric coupe SUV, the ET7, a smart electric flagship sedan, and the ET5, a mid-size smart electric sedan.
Nio is considered a trailblazer in the Chinese premium electric vehicle market. The company designs, produces and vendors connected electric vehicles, using smart innovations in autonomous driving, artificial intelligence and connectivity.
The company introduced its first EP9 supercar in 2016. Nio aimed to deliver exceptional speeding up and innovative technology of the electric powertrain.
In 2017 the company launched its first high-volume manufactured EV model, the ES8, which is a seven-seater SUV with the body made completely from aluminum alloy. Later, in 2019, Nio started the first sales of the ES6, a 5-seater electric SUV.
Besides smart vehicles, the company offers additional services, including Power Swap, a battery swapping service, Power Home, a home charging solution, and Power Mobile, offering charging services through special trucks. The company also offers Power Express – an on-demand pick-up and drop-off charging service available 24 hours a day.
Founded in 2014, Nio is headquartered in Shanghai. Nio shares floated on the New York Stock Exchange through an $1.8bn IPO in 2018. Since then the Nio stock quote has been listed and traded on the NYSE.
Since the beginning of 2020, the Chinese electric vehicle manufacturer has positioned itself as a strong competitor for the iconic EV maker Tesla. During roughly 10 months of the year it generated an impressive 600 per cent return for investors.
The price of Nio stock showed an extraordinary performance, driven by an overall optimistic outlook for the electric vehicles industry and subsequent analysts’ price target hikes, which boosted the company’s valuation to $39bn.
Looking closely at the Nio stock price chart we can notice that a serious bull run started in June 2020 as the coronavirus pandemic accelerated a shift towards renewable energy sources.
In times when numerous countries have started favouring electric vehicles as an effective way to decrease the level of pollution, Nio has emerged as a well-grounded business capable of bringing significant profit from the world’s transformation and transition from fossil fuels to alternative sources of energy. This serves as one of the major reasons why the Nio Limited share price has seen a significant upside momentum recently.
Nio stock has skyrocketed since the end of May. Analysing the Nio stock today, we can say that in a 1-year period the NIO share value has been fluctuating within a range of $1.66 – $54.20. Providing their Nio stock predictions for the next 12 months the majority of Wall Street investors are rating the stock as a buy.
The company shared an ambitious goal to produce a total of 150,000 vehicles in 2021, which is a boost of 28,000 units per quarter. This plan can also contribute to a successful Nio stock rally once achieved.

$NIOProvided we Reclaim and Hold 8.38 ill be looking for $33 as next resistance, longer term (5-10) years im bullish NIO, If 8.38 acts as resistance next area ill be looking at is $5.36 ish

NIO is on a bounceNIO has descended into its demand zone as shown on the 2H Chart.
It is now above the POC line of the near-term volume profile.
I will take a trade here setting a stop loss of 7.33 below the near-term high
volume area. The first target will be 7.6 which is approximately the anchored
VWAP ( thick black line ) confluent with the POC line of the intermediate
term volume profile to take half the profits. The remainder of the position
will target 8.9 which is just below the selling volume shelf at 9.0.
Tipranks has a longer term target of 14 ( see the link below)

$NIO - 3.88 PRICE TARGET - Dangerous Bearish F flag breakdown!Nio is in a dangerous zone, it recently broke down its bearish f flag. the stock has been in a downward channel with many bearish flags continuing to play out, a new leg has been created. the target now is the leg of the previous leg of the previous flag. there is also a support from 2019 which also correlated to the price target of $3.88. continue to short from here.

hold on to your assethold on to your asset
smart money wants to scare you
NIO's April deliveries rise more than 30%, but stock turns red
NIO's stock rose Monday, along with the shares of fellow China-based EV makers Li Auto and XPeng, after April deliveries were reported.

Pursuit of the the next Tesla..!Most people invest their money in these 3 companies, NIO, LUCID, Rivian, or all of them because they had missed the opportunity to participate in the inflationary phase of the Tesla Bubble..!
Unfortunately, now the deflationary phase of the bubble overlap, and they are coming down on the latitude mode..!
People who invested in these stocks have lost more than 2/3 of their money and it will not be back soon..!
Why?
Because these companies do not generate meaningful revenue to become interesting for big players..!
I forecast single-digit price tags for all of them in 2022, NIO could go down to 5 or below..!
Best,
Dr . Moshkelgosha M.D
DISCLAIMER
I’m not a certified financial planner/advisor, a certified financial analyst, an economist, a CPA, an accountant, or a lawyer. I’m not a finance professional through formal education. The contents on this site are for informational purposes only and do not constitute financial, accounting, or legal advice. I can’t promise that the information shared on my posts is appropriate for you or anyone else. By using this site, you agree to hold me harmless from any ramifications, financial or otherwise, that occur to you as a result of acting on information found on this site.

NIO AnalysisPrice finally took the sell-side liquidity at 8.03 after many weeks and is now mitigating the bullish POI at 7.90 as expected. Expect some bullish retracement from here into the bearish POI at 10.03.

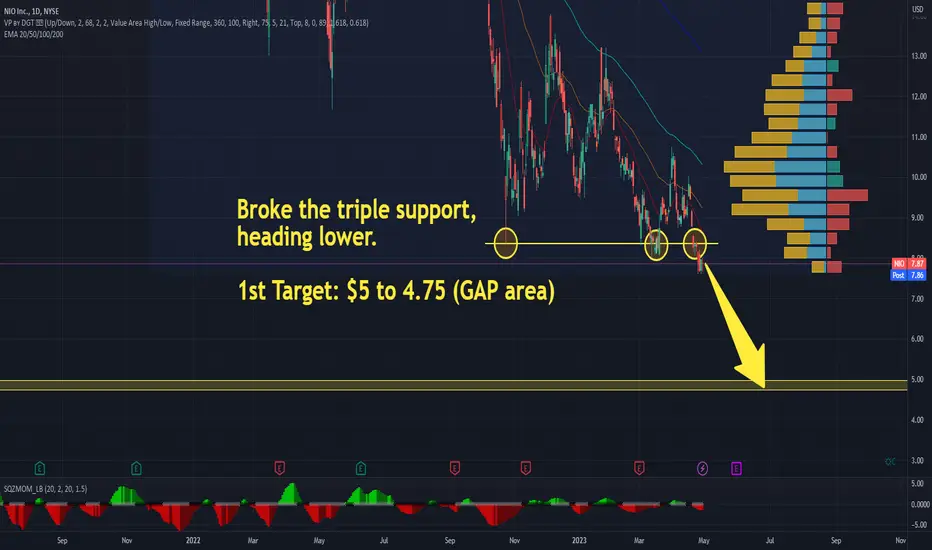
$NIO - Target $4.75. BEARISH Flag and Support Line BrokeNio stock broke the support line and bearish flag and is heading lower. First target is at a gap that hasn't been filled at $4.75
$NIO - 5 Year Swing PlanApproaching value area
Will begin averaging in as it approaches HKEX:6 and below

Nio 4/23 Long As you can see the last green candle from April 20, can be seen with its wick going all the way down to
Nio's support, which it had previosuly touched and broken out. I believe that NIO is desitned for another breakout, and entry
at this point would be great; You can see the same trend play out on the hourly chart;

This nio is a challenge. Went fro m being a triangle break out Triangle break out the shoulders of the training room doesn't Grapher to see if it hits should go down a buck 60 from nine till 740

NIO: Sell ideaOn NIO as you see on the chart we have the breakout of the vwap and also the breakout of the support line so it's mean that we will have a big probability to have a downtrend. Thanks!

NIO Short & Then LongOn the daily chart, Nio can be seen on the downtrend for a while
So far, a support has formed around 8.09, and Nio has bounced back up from it, but I expect to drop down
to that support again, and then finally have a breakout

NIO Targets will intersect 2/1 gann line as it forms the cup which should add to positive momentum. Squeeze, MACD and price divergence over last 3 months.

NIO AnalysisPrice took liquidity at 8.84 and broke market structure to the upside. Following the bullish momentum on the lower timeframe, I'm expecting price to continue higher, potentially into the bearish POI at 13.22 next.

NIO, a discounted stock bound for inevitable growth!NIO has been performing quite well in terms of fundamentals this past quarter -- and price has started aligning to it.
NIO broke out of the weekly down trendline bouncing off major order block support at 7.0 to 8.0 levels. A significant reversal to the upside is inevitable.
On the weekly data (histogram), it has created a significant higher lows multiple times suggesting ascend momentum. Volume traded has jump to +10M from its average.
SEEDED long at 9.00
TAYOR.
--------------------
FUNDAMENTAL NEWS:
NIO Inc. Provides March and First Quarter 2023 Delivery Update
NIO delivered 10,378 vehicles in March 2023
NIO delivered 31,041 vehicles in the three months ended March 2023, increasing by 20.5% year-over-year
Cumulative deliveries of NIO vehicles reached 320,597 as of March 31, 2023

NIO CONSILIDATION AND LAUNCH IMMINENTI'm expecting NEO to hit aroudn $10.50 then climbd to 12.00 at which point i am exiting call options and will re-enter shortly thereafter. Neo has is bouncing off the longest term trendline that exists which was created shortly after the IPO. Chgeck out my DOCUSIGN POST that could be a cow. Also I have January 30 Calls on NIO - check out the profitability if Nio and Tesla shift positive momentum.
\

NIO buyNio Inc is a Chinese multinational automobile manufacturer headquartered in Shanghai, specializing in designing and developing electric vehicles.

NIO, -54.71%falling cycle -54.71% more than 10 days.
==================================================================================================================================================================
This data is analyzed by robots. Analyze historical trends based on The Adam Theory of Markets (20 moving averages/60 moving averages/120 moving averages/240 moving averages) and estimate the trend in the next 10 days. The white line is the robot's expected price, and the upper and lower horizontal line stop loss and stop profit prices have no financial basis. The results are for reference only.
