Strong Growth Trend should continueTGTX was ~$6 in Oct 2023 and has since seen a strong upward trend. Based on the growth estimates from Briumvi, I expect this trend to continue on the weekly chart. I believe this stock will be double its current value in the next 2 years.
NKB2 trade ideas

Trading Journal $TGTX Another stock that hold up well during market correction, rebought it after wild day, inside day breakout.
Moved up ~20% from initial buy, but gave it all up on bad earnings reaction day.
Could set up again, but underneath the 50 day MA so sold

TGTX – Long Trade Setup !📈🟢
Ticker: TG Therapeutics, Inc. (NASDAQ: TGTX)
Chart: 30-Min Timeframe
Pattern: Ascending triangle breakout
🔹 Entry: $41.31 (breakout + reclaim above trend)
🔹 Stop-Loss: $39.93 (below trendline + support zone)
🔹 Take Profits:
TP1: $43.12 – Previous resistance
TP2: $45.04 – Measured move / breakout target
⚖️ Risk-Reward Calculation
– Risk per Share: $1.38
– Reward to TP2: $3.73
– R:R Ratio: ~1:2.7 ✅
🧠 Technical Highlights
– Ascending triangle with tight breakout range
– Strong reclaim of resistance near $41
– Volume rising during squeeze

$TGTX - 4 BreakoutsThe fourth-quarter results were well received by analysts.
There were 4 breakouts from yesterday to today:
Breakout of the 3-Month Simple Moving Average
Breakout of the Weekly Heiken Ashi Highs and Lows Average
Breakout of the 3-Month Donchian Channel High
Breakout of the Downtrend Line
We also see that these breakouts were driven by a surge in vertical volume and within the horizontal volume range.
All aboard.

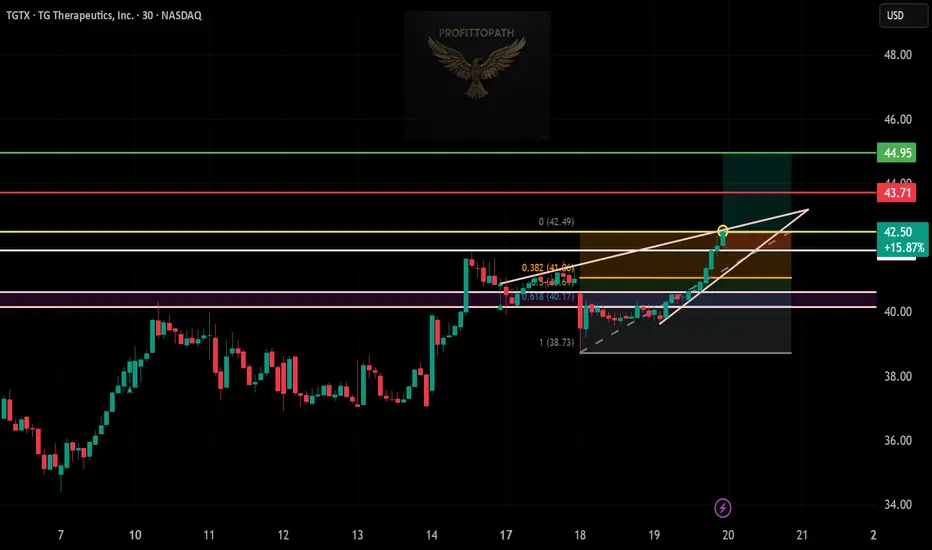
TGTX (TG Therapeutics, Inc.) – 30-Min Long Trade Setup! 🚀
🔹 Asset: TGTX – NASDAQ
🔹 Timeframe: 30-Min Chart
🔹 Setup Type: Bullish Breakout (Rising Wedge & Fibonacci Retracement)
📊 Trade Plan (Long Position)
✅ Entry Zone: Above $42.50 (Breakout Confirmation)
✅ Stop-Loss (SL): Below $40.17 (Key Support Level)
🎯 Take Profit Targets
📌 TP1: $43.71 (Resistance Level)
📌 TP2: $44.95 (Extended Bullish Move)
📊 Risk-Reward Ratio Calculation
📉 Risk (SL Distance):
$42.50 - $40.17 = $2.33 risk per share
📈 Reward to TP1:
$43.71 - $42.50 = $1.21 (1:0.52 R/R)
📈 Reward to TP2:
$44.95 - $42.50 = $2.45 (1:1.05 R/R)
✅ Favorable Risk-Reward Ratio toward TP2
🔍 Technical Analysis & Strategy
📌 Rising Wedge Breakout: Price action is holding above key levels, signaling bullish momentum.
📌 Fibonacci Confluence: The 0.382, 0.5, and 0.618 Fibonacci retracement levels provide strong support.
📌 Volume Confirmation Needed: Look for above-average buying volume above $42.50 to validate the breakout.
📌 Resistance at $43.71: A breakout above this will strengthen the bullish move toward TP2.
📉 Trade Execution & Risk Management
📊 Volume Confirmation: Ensure strong buying volume above $42.50 before entering.
📉 Trailing Stop Strategy: Move SL to break-even ($42.50) after hitting TP1 ($43.71).
💰 Partial Profit Booking Strategy
✔ Take 50% profits at TP1 ($43.71), let the rest run toward TP2 ($44.95).
✔ Adjust Stop-Loss to Break-even ($42.50) after TP1 is reached.
⚠️ Risks & Considerations
❌ Fake Breakout Risk: If the price fails to hold above $42.50, exit early.
❌ Confirmation Required: Wait for a 30-min candle close above $42.50 before entering.
🚀 Final Thoughts
✔ Bullish Setup – Strong upside potential.
✔ Momentum Shift Possible – Watch for volume confirmation.
✔ Favorable Risk-Reward Ratio – 1:1.05 toward TP2.
💡 Stick to the plan, manage risk, and trade smart! 🚀📈
🔗 #TGTX #NASDAQ #LongTrade #TradingView #ProfittoPath 💰📊
TG Therapeutics (TGTX) – Biotech Innovation & Global ExpansionCompany Overview:
TG Therapeutics NASDAQ:TGTX is a biotech leader focused on novel cancer and autoimmune treatments, gaining momentum as an IBD Leaderboard and IBD 50 Top 10 Growth Stock.
Key Catalysts:
Regulatory Approvals & Expansion 🌍
BRIUMVI secured approvals in Europe & the UK, unlocking new revenue streams in key markets.
Strong Profitability & Growth 💰
88.3% gross margin ensures sustainable reinvestment into R&D and future pipeline advancements.
High-Growth Stock Recognition 📊
Technical strength is validated by its inclusion in top-performing stock lists, signaling strong investor confidence.
Investment Outlook:
Bullish Case: We are bullish on TGTX above $34.00-$35.00, driven by global expansion, financial strength, and biotech leadership.
Upside Potential: Our price target is $55.00-$56.00, supported by continued innovation and market penetration.
🔥 TG Therapeutics – Pioneering the Future of Cancer Treatment. #TGTX #Biotech #GrowthStocks

TGTX/USD – 30-Min Long Trade Setup!📌 🚀
🔹 Asset: TGTX (TG Therapeutics, Inc.)
🔹 Timeframe: 30-Min Chart
🔹 Setup Type: Bullish Breakout Trade
📌 Trade Plan (Long Position)
✅ Entry Zone: Above $40.96 (Breakout Confirmation)
✅ Stop-Loss (SL): Below $39.25 (Invalidation Level)
🎯 Take Profit Targets:
📌 TP1: $42.86 (First Resistance Level)
📌 TP2: $45.33 (Extended Bullish Move)
📊 Risk-Reward Ratio Calculation
📉 Risk (SL Distance):
$40.96 - $39.25 = $1.71 risk per share
📈 Reward to TP1:
$42.86 - $40.96 = $1.90 (1:1.1 R/R)
📈 Reward to TP2:
$45.33 - $40.96 = $4.37 (1:2.56 R/R)
🔍 Technical Analysis & Strategy
📌 Bullish Flag Breakout: The price has broken a consolidation zone, signaling a bullish continuation.
📌 Retest Confirmation: Price is retesting $40.96, a previous resistance now acting as support.
📌 Strong Uptrend: Higher highs and higher lows confirm bullish momentum.
📌 Key Support at $39.25: If the price holds above this, bullish momentum remains valid.
📊 Key Support & Resistance Levels
🟢 $39.25 – Stop-Loss / Strong Support
🟡 $40.96 – Breakout Level / Long Entry
🔴 $42.86 – First Resistance / TP1
🟢 $45.33 – Final Target / TP2
📉 Trade Execution & Risk Management
📊 Volume Confirmation: Ensure high buying volume above $40.96 before entering.
📉 Trailing Stop Strategy: Move SL to entry ($40.96) after TP1 ($42.86) is hit.
💰 Partial Profit Booking Strategy
✔ Take 50% profits at $42.86, let the rest run toward $45.33.
✔ Adjust Stop-Loss to Break-even ($40.96) after TP1 is reached.
⚠️ Fake Breakout Risk
❌ If the price fails to hold above $40.96 and drops back below, exit early to avoid losses.
❌ Wait for a strong bullish candle close above $40.96 before entering aggressively.
🚀 Final Thoughts
✔ Bullish Setup – Breaking above $40.96 signals potential continuation.
✔ Momentum Shift Possible – Watch for volume confirmation.
✔ Favorable Risk-Reward Ratio – 1:1.1 to TP1, 1:2.56 to TP2.
💡 Stick to the plan, manage risk, and trade smart! 🚀📈
🔗#StockMarket 📉 #TradingNews 📰 #StockAnalysis 📊 #MarketUpdate 🔥 #Investing 💰 #Trading 📈 #Finance 💵 #ProfittoPath 🚀 #SwingTrading 🔄 #DayTrading ⚡ #StockTrader 💸 #TechnicalAnalysis 📉 #MarketTrends 📊 #StockAlerts 🔔 #TradeSmart 🤓 #Bullish 🐂 #RiskManagement ⚠️ #TradingCommunity 🤝

TGTX – 30-Min Long Trade Setup!📌 🚀📈
🔹 Asset: TG Therapeutics, Inc. (NASDAQ: TGTX)
🔹 Timeframe: 30-Min Chart
🔹 Setup Type: Bullish Breakout Trade
📌 Trade Plan (Long Position)
✅ Entry Zone: Above 38.45 (Breakout Confirmation)
✅ Stop-Loss (SL): Below 37.43 (Invalidation Level)
🎯 Take Profit Targets:
📌 TP1: 40.04 (First Resistance Level)
📌 TP2: 41.77 (Extended Bullish Move)
📊 Risk-Reward Ratio Calculation
📉 Risk (SL Distance): 38.45 - 37.43 = 1.02 risk per unit
📈 Reward to TP1: 40.04 - 38.45 = 1.59 (1:1.56 R/R)
📈 Reward to TP2: 41.77 - 38.45 = 3.32 (1:3.25 R/R)
🔍 Technical Analysis & Strategy
📌 Bullish Trendline Breakout: Price is breaking key resistance, confirming bullish momentum.
📌 Support Confirmation: Strong demand at 37.43, acting as a buying zone.
📌 Volume Confirmation Needed: Increased buy volume above 38.45 confirms momentum.
📌 Momentum Shift Expected: If price sustains above 38.45, it could rally toward 40.04, then 41.77.
📊 Key Resistance & Support Levels
🟢 41.77 – Final Target / TP2
🔴 40.04 – First Resistance / TP1
🟡 38.45 – Breakout Level / Long Entry
⚪ 37.43 – Stop-Loss / Support Level
📉 Trade Execution & Risk Management
📊 Volume Confirmation: Ensure strong buying pressure above 38.45 before entering.
📉 Trailing Stop Strategy: Move SL to entry (38.45) after TP1 (40.04) is hit.
💰 Partial Profit Booking Strategy:
✔ Take 50% profits at 40.04, let the rest run toward 41.77.
✔ Adjust Stop-Loss to Break-even (38.45) after TP1 is hit.
⚠️ Fake Breakout Risk
❌ If price drops below 38.45 after breakout, exit early to limit losses.
❌ Wait for a strong bullish candle close before entering aggressively.
🚀 Final Thoughts
✔ Bullish Setup – Trendline breakout signals upside potential.
✔ Momentum Shift Possible – Watch for volume confirmation.
✔ Risk-Reward Ratio – Favorable 1:3.25 R/R to TP2.
💡 Stick to the plan, manage risk, and trade smart! 📈🔥
🔗 Hashtags for Reach & Engagement:
#TGTX 🚀 #NASDAQ 📈 #StockTrading 📊 #TradingNews 📰 #MarketUpdate 🔥 #Investing 💰 #LongTrade 🏆 #Finance 📉 #ProfittoPath 🏆 #SwingTrading 🔄 #DayTrading ⚡ #TechnicalAnalysis 📉 #StockSignals 📊 #FinancialFreedom 💡 #MarketTrends 📊 #StockAlerts 🔔 #TradeSmart 🤓 #Bullish 📈 #RiskManagement ⚠️ #TradingCommunity 🤝 #SmartTrading 💰 #MarketAnalysis 📊 #TrendBreakout 🚀

TG Therapeutics (TGTX): Biotech Advances Fuel ExpansionTG Therapeutics, Inc. (TGTX) is a biopharmaceutical company focused on developing and commercializing treatments for B-cell diseases, including cancers and autoimmune disorders. The company’s lead therapies target conditions like multiple sclerosis and leukemia, offering innovative solutions in a growing market. With strong demand for new treatments and ongoing clinical advancements, TG Therapeutics continues to expand its pipeline and gain investor interest.
The stock chart recently displayed a confirmation bar with rising volume, pushing the price into the momentum zone, which occurs when it moves above the 0.236 Fibonacci level. This signals strong investor confidence and suggests the potential for continued upside as buying interest strengthens.
Traders set stops based on Fibonacci levels so they can ride the trend while locking in profits if momentum slows. This strategy keeps gains secure while preventing early exits in strong uptrends.

$TGTX Stock Set For Breakout Amidst Symmetrical Triangle PatternTG Therapeutics, Inc. (NASDAQ: NASDAQ:TGTX ) a biopharmaceutical company, that focuses on the acquisition, development, and commercialization of novel treatments for B-cell mediated diseases in the United States and internationally is set for a breakout amidst a bullish symmetrical triangle pattern.
Analyst Forecast
According to 6 analysts, the average rating for TGTX stock is "Strong Buy." The 12-month stock price forecast is $40.67, which is an increase of 35.16% from the latest price.
Important Dates
The next confirmed earnings date is Monday, March 3, 2025, before market open.
On How the bullish symmetrical plays out is largely incumbent on the earnings report slated for today Monday March 3, 2025 before the bell.

TG Therapeutics forming 3rd baseIs a company that develops and commercializes novel treatments for B-cell diseases
The stock initiated a bull trend at the end of 2023 after a breakaway gap and has gained +90% during 2024 and gave 2 opportunities to buy on breakouts
Now is forming a 3rd base and may give another opportunity to enter, all this while relative to its sector AMEX:XLV is making new highs
According to IBD is not among the industry leaders, but it has a 96 Relative Strength Rating against the SP:SPX


TG Therapeutics (TGTX) Analysis Company Overview: TG Therapeutics NASDAQ:TGTX is a biopharmaceutical company focused on developing and commercializing innovative treatments for B-cell diseases. The company's recent FDA approval of BRIUMVI for relapsing multiple sclerosis (RMS) marks a significant milestone, positioning TG Therapeutics to capitalize on a high-demand therapeutic area.
Key Developments:
FDA Approval of BRIUMVI: The approval of BRIUMVI for relapsing multiple sclerosis opens access to a substantial market, with nearly 1 million individuals in the U.S. affected by RMS. This provides a significant revenue opportunity, with BRIUMVI offering a new treatment option that has shown favorable efficacy, safety, and convenient dosing compared to existing therapies.
Positive Market Reception: CEO Michael S. Weiss has expressed strong confidence in BRIUMVI's potential, noting positive feedback from both healthcare providers and patients. The drug's unique value proposition lies in its twice-yearly dosing, which is more convenient than the monthly or quarterly regimens offered by competitors, enhancing patient compliance and satisfaction.
Pipeline and Future Growth: The successful launch of BRIUMVI is a testament to TG Therapeutics' ability to introduce novel treatments. This sets a strong foundation for future developments in B-cell disease therapies, as the company explores additional indications and expands its pipeline. BRIUMVI's performance in the market could pave the way for further advancements in TG Therapeutics' product offerings.
Investment Outlook: Bullish Outlook: We are bullish on TGTX above the $21.00-$22.00 range, driven by the strong initial reception of BRIUMVI and its potential to capture a significant share of the RMS market. Upside Potential: Our price target for TG Therapeutics is set at $34.00-$35.00, reflecting the expected revenue growth from BRIUMVI and the company's strategic positioning in the biopharma sector.
🚀 TGTX—Leading the Way in B-cell Disease Therapies! #BiopharmaInnovation #MultipleSclerosis #NewTreatmentOptions

New Setup: TGTXTGTX: I have a green setup signal(dot Indictor). It has an excellent risk-to-reward ratio(RR:). I'm looking to enter long near the close of the day if the stock can manage to CLOSE above the last candle highs(white line). If triggered, I will then place a stop-loss below(SL) and a price target above it(TP).
********
Note: The above setups will remain valid until the stock CLOSES BELOW my set stop-loss level.

Short potential on TGTXShort-term structural looks bullish for TGTX.
But looking on bigger perspective TGTX is having structural bearishnes for years.
Possible short setup at 30ish level.


TGTX, 3/1-3/8, -2% lossOn 2/28/2024, TG Therapeutics (TGTX) reported a loss of $0.09 per share on revenue of $43.97 million for the fourth quarter ended December 2023. The consensus estimate was a loss of $0.12 per share on revenue of $40.06 million.

TGTX Its a point where it can go buy from, but its a weak price point at $17 - $18. it has to show me a reversal pattern to consider buying from those prices.
The best situation is if the price decreases to around $13 - $14 to buy until $25 that's 80% growth.

TG Therapeutics Gains After Strong Q3 BeatTG Therapeutics (NASDAQ:TGTX) added ~21% pre-market Wednesday after the company posted solid topline and bottom-line beats with its Q3 2023 financials.
The Morrisville, North Carolina-based biotech reported $165.8M in net revenue for the quarter, up from $94M in the prior-year period, exceeding the consensus by as much as $102.5M.
A one-time payment of $140M from Neuraxpharm, its ex-U.S. partner for multiple sclerosis therapy Briumvi, boosted the top line.
However, Briumvi's net sales also exceeded the company's expectations, reaching $25.1M from $16M in Q2 2023. The FDA approved the anti-CD20 monoclonal antibody in late 2022, leading to its commercial launch in January.
TG Therapeutics (TGTX) recorded 900 Briumvi prescriptions for Q3, taking the total prescriptions for the drug to 2,200 since its launch.
Meanwhile, the company's SG&A expenses reached $32.8M, a twofold rise from Q2 2022. However, given the strong topline growth, TG Therapeutics (TGTX) reported $113.9M in net income compared to $35.8M of net loss in the prior year period.

$TGTX 4R trade ideaTGTX on pullback to the OB can benefit with a 4R is my thought. let me know what you think

$TGTX LongFalling wedge within a larger broadening wedge.
Daily hidden bullish divergence.
Strong bull trend above the 150MA.

$TGTX - Pullback and consolidationTop trading idea for next week(s)!
NASDAQ:TGTX already proved itself with a strong performance YTD of 125% (and 580% in a year).
The stock is in a clear stage 2 uptrend and is now consolidating in between the 21 day MA and 50 day EMA on lower volume (check weekly chart).
Has the fundamentals.
A few more days of tight consolidation or a quick retest of the 50 EMA would make it even a better setup and creates a launchpad.
Entry would be around 28.27
Stop breach of the 50 on high volume or a tight stop low of the day (when it breaks the pivot).
Enjoy next week!
Other similar ideas: NYSE:SKX , NASDAQ:WING and NASDAQ:ARCT

Pullback Buy in TGTXBiotech stocks can make huge moves, and this one is no exception.
TGTX more than doubled in a month and is showing no signs of slowing down.
Slower-trending, blue chip stocks tend to ride their 50-day moving average (red line on chart) on the way up.
Stronger stocks tend to hold their 21-day moving average (blue line).
But with high-flying honey badger stocks like TGTX, you are lucky to get a pullback to the 10-day (yellow line).
TGTX touched its 10-day exponential moving average on Friday, making this the first real pullback buying opportunity since the initial surge.
I would consider buying here with an 8-10% stop loss.
