NMM trade ideas

Newmont: Game Time! 💰💰💰The Newmont stock has reached an important mark within the chart, and we are waiting for the stock to turn around. If we stay above $54.18, we continue to expect the price to crush through the resistance at $75.31 and proceed to tackle prices above $90. However, a 45% chance of falling below $54.18 remains, which would lead to further declines.
Go Bulls, Go!

TRADE JOURNAL (#1): LONG NEM First of the many trade journal entries to keep me grounded. A way to measure the profitability of my setups.
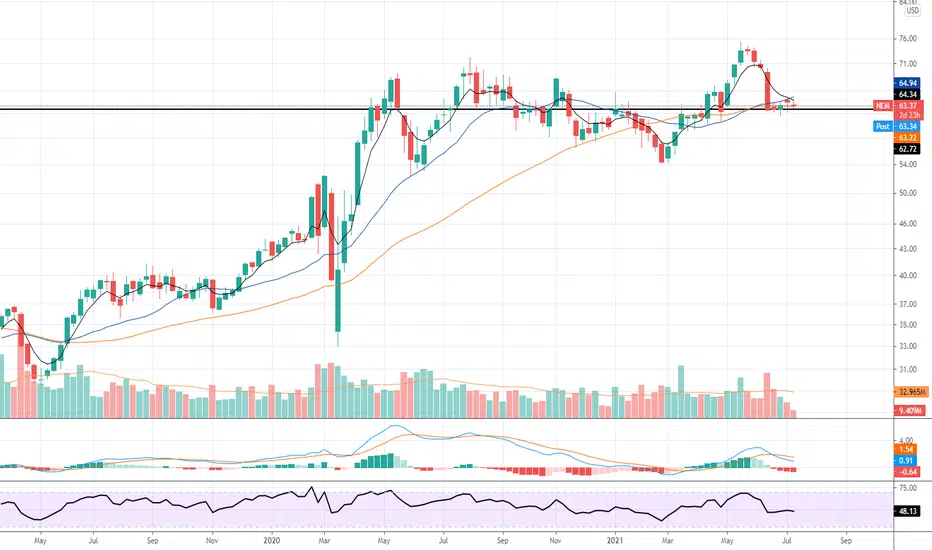
NYSE:NEM :
Price had pullback to retest its previous breakout level around $62.20 and is testing the lows that generated the momentum for the breakout ( support and resistance).
The whole bullish momentum retraced to the 76.4% retracement level. May indicate a proper support zone for the coming days (Fib), where TVC:GOLD is still holding its bullish momentum.
S/L was kept relatively tight, inside the previous channel. A price test of 54.19 would still support the buy trade as long as this level holds; T/P @ 1.272 Fib. ext.

NewmontIn the last idea I assumed the stock would drop to 60. Now I'm assuming again that they will go up


NewmontStrategy/Chart pattern: Positive divergence at support
Entry: 63.87$
Stop: 60.50$
Target: /
Risk/Reward-Ratio: /
Stopmanagement: Parabolic SAR stops daily chart default settings

NEM BUY/LONG SHORT TERM ANYTIME SOONTICKER CODE: NEM
Company Name: NEWMONT CORPORATION
Industry: US Stocks Non-Energy Minerals Precious Metals
Position Proposed: BUY/LONG
Entry: 62.80- 63.00 NOW READY
1st Partial Take Profit: 66.05
Stop Loss: 61.05
Technical Analysis
1. Rising Wedge completed (Breakout already)
2. Head & Shoulder (Shoulders forming)
3. RSI OVERSOLD ( price will go up a while)
4. Area of confluence (EMA, structure level & Trendline)

2021-06-23 NEWMONT - long continuationPrice contained in the arc and retracing to 61.8% of last upswing on weekly.
Let's hope this holds and price continue higher

Newmont and the possible reversalAfter the huge selloff in the gold market there are several signs of a possible reversal of Newmont.
So let´s sum up the body of evidence:
1. The price is right at a significant support level
2. It has formed a hammer reversal pattern at the support level
3. We have a positive divergence with the RSI and MACD
4. At the support level we saw a spike in the volume although the price was not selling off anymore. This is a sign of a allocation
5. A Entry when the RSI reading was below 35 in the daily chart was in the recent past a profitable strategy

Newmount Buy Zone ReachedNewmount reached 66% Retracement.
NEM goes to watch list. MACD not right now signal a buy... so a little bit pacient may be good.
To be on a rebounce of gold in the next weeks... Bullish... Only on Watchlist

NEM a buy?MACD is downwards right now and some distance to fibannaci Retracement is there.
On Alert / Watchlist for a later buy, if a drawdown will happen.
In long range still bullish for gold

$NEMLooking like a 5 wave theory in play. Possibly on wave 4. Using box range to find target which lines up with fib target zone


NEM : RESET / POSITION TRADE / HEDGENewmont Mining just came off a record quarter in Q3 with free cash flow of ~$1.3 billion, and increased its dividend by 60% to $1.60 per share annually.
Despite these bullish developments, the stock has slumped with the rest of the sector, down more than 20% from its August highs.
This correction has left the stock trading below 13x FY2021 annual EPS estimates, with a dividend that's 70% higher than that of the S&P 500.
Therefore, if we see any further weakness below $57.25, I would view this as a low-risk buying opportunity for long-term investors looking for steady free cash flow and yield.
seekingalpha.com


NEM holding solid for longNEM has increased guidance and has a bull flag forming. FWD P/E lower than current and 10 points lower than industry average FWD P/E.
Looking for entry below 74 and TP of 79 to hold with stop loss at 76 for 25% of position.


$NEM 30 year highs - 30-50% more upside$NEM has closed at its highest price since 1987. I have selected 2 fibonacci extensions and the measured move of the bull flag. The red extensions from the first impulse move post-IPO have a history have a long history of marking months long consolidations and decade long tops. For this reason I believe the next fibonacci level $114 is now the most reasonable 'long term' price target.

What does one of the largest precious metals miners tell you?This is a quarterly breakout - find me a chart that looks like this....
My view on silver long term:
Junior miners about to breakout:
Silver long is my largest holding

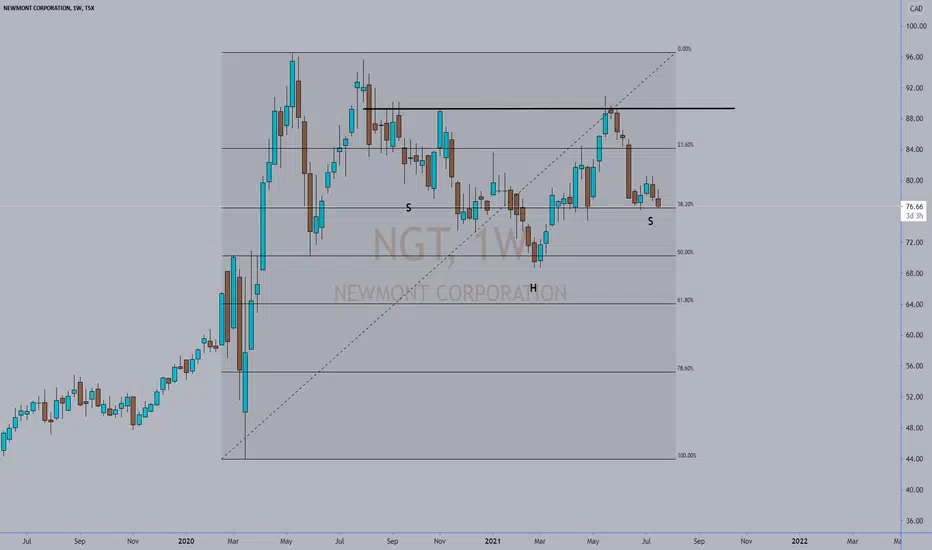
Newmont CorporationChart pattern: Bull flag
Entry: 65.78$ (this would end the downtrend which is active since the beginning of August 2020)
Stop: 54.18$
Target: 93.354
Stopmanagement: ATR Stops weekly chart default settings
Risk:Reward-Ratio: > 2.3:1
Description: Since August 2020 the chart is forming a bull flag with a nice corrective pattern (which retraced under the 38 Fibonacci retracement). Target is the 1:1 Fibonacci extension of the former impusliv move. Additionally, the MACD is also confirming the change in trend.
Ordersize: If you have a 10000K to trade and you only want to risk 1% of your volume, you can enter this trade with 570$.

