Nokia remains one of my favorite long-term technology playsI've been buying long-term (2022) calls on Nokia, and they're performing very well this past week. The good news for Nokia has kept rolling in throughout this coronavirus downturn, and Nokia announced today that it has declared a total of 3,000 patents related to 5g. Last year it looked like Nokia was falling behind in the 5g race, but ever since it suspended its dividend to free up cash flow for R&D, it has been fast making itself a 5g leader. Along with BIDU, NOK is one of my favorite long-term tech plays due to low valuation and a large number of hot new technology patents going into product development that should pay off long-term. I will buy more calls on the dips.
NOA3 trade ideas

The downtrend is broken. Estimated target is 5,48.The downtrend channel is broken. I predict short term target is 5,48 by the end of September 2020.


Paper trading - no excuse not too !!!!everyone should paper trade,, i start quarterly paper trading 20k account with goal of making 50% per quarter
you must develop your skills
trading view has a fantastic paper trading system, there is NO EXCUSE not to paper trade, its easy, and we can ALL IMPROVE

GoNoGo Charts: Nokia's run in trouble?Nokia’s “Go” trend is being tested. The quick retracement from the highs of this current rally show the GoNoGo Trend painting paler blue, weaker trend bars.
The recent high was not confirmed by the GoNoGo Oscillator as we see lower highs in the lower panel.
Price is also testing support from what many would consider a broadening formation (megaphone), with diverging *trend lines. This pattern suggests disagreement between the bulls and the bears with increased *volatility in the price swings. Typically, this is considered to be *bearish.
To add to this, the GoNoGo Oscillator has dipped negative for the first time since the rally began. This negative momentum increasing the possibility that the trend may struggle to stay a “Go”.
What are the GoNoGo Indicators?
The GoNoGo Trend indicator blends traditional trend concepts to color price action according to the strength of its trend. The colors range from *bright blue (strongly *bullish) to dark *purple (strongly *bearish)
The GoNoGo Oscillator blends traditional *momentum concepts to demonstrate the velocity of price action. The oscillator ranges from -6 (extremely *oversold) to +6 (extremely *overbought)

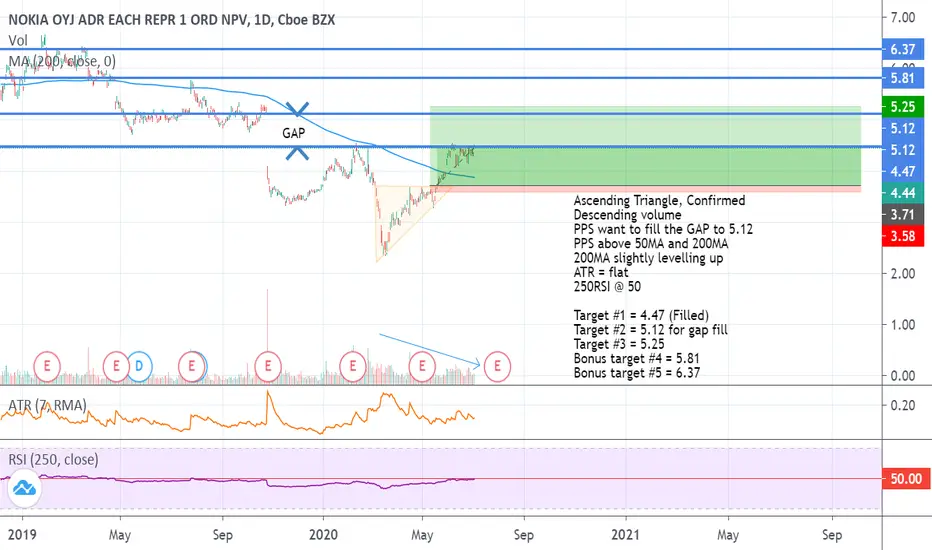
NOK: Ascending triangleAscending Triangle, Confirmed
Descending volume
PPS want to fill the GAP to 5.12
PPS above 50MA and 200MA
200MA slightly levelling up
ATR = flat
250RSI @ 50
Target #1 = 4.47 (Filled)
Target #2 = 5.12 for gap fill
Target #3 = 5.25
Bonus target #4 = 5.81
Bonus target #5 = 6.37
Nokia transformedRead this news here
The 3 telcos that dominate the telecommunication market in Singapore has awarded the 5G contract to Nokia and Ericsson.
I am quite optimistic on this Company. This will be a long term play, one that you can buy and keep in the drawer for a while.

NOKIA bullish asfTempted to buy some $NOK $5/$6 calls, just debating how far out to buy them. Expecting a little more consolidation if I'm being honest, but these 5G contracts and talks could send this flying sooner.
White House/President Intervention to secure 5G could make this print.
I am worried about bearish market affecting this trade but not really...

Bullish Sector - 5G Play, Golden CrossNokia Corporation engages in the network and technology businesses worldwide. The company operates in four segments: Ultra Broadband Networks, Global Services, IP Networks and Applications, and Nokia Technologies. It focuses on mobile radio including macro radio, small cells, and cloud native radio solutions for communications service providers and enterprises; and provides network planning and optimization, network implementation, and systems integration, as well as company-wide managed services. The company also offers fixed networking solutions, such as copper and fiber access products, solutions, and services. In addition, it provides network infrastructure and professional services for mobile networks; and managed services for the fixed, mobile, Internet protocol (IP), and optical domains. Further, the company offers network planning, implementation, operation, and maintenance services. Additionally, it provides IP/optical networking solutions, including IP routing and optical transport systems, software, and services; software solutions, such as customer experience management, network operations and management, communications and collaborations, policy and charging, as well as Cloud, IoT, security, and analytics platforms; and submarine networks and radio frequency systems. The company has a strategic collaboration with Microsoft. Nokia Corporation was founded in 1865 and is headquartered in Espoo, Finland.
Nokia continues receiving 5G contracts.
On the Daily Chart, the 50-Day MA is ready to Cross up and over the 200-Day MA, Bullish
I think NOK has a shot at reversing its downward trend real soon especially if the USA takes an ownership in the company like many White House officials have been talking about possibly doing to stop China.
Long!
DISCLAIMER
The Content herein is for informational purposes only, you should not construe any such information or other material as legal, tax, investment, financial, or other advice.

$NOK avoiding for now$NOK Multi year declining channel
5G play and with new towers and collaborations people suspect Nokia is staging a comeback.
Since we focus on swing trading, I believe there is better risk reward plays out there. We can find 20% in a week or two, this will take up more time & freeze up capital to do so.
If you insist, on playing the channel, $NOK is back where it was pre corona.

$NOK Nokia 5G trade setup
Gap fill potential
Bullish setup -
Golden cross imminent
Strong news flow fundamentals
Alert set for break above $4.50
Upside target $4.80- $5.10
Press Release
Nokia launches cloud-native Digital Operations Center software to drive 5G monetization
Digital Operations Center is Nokia’s first automated, cross-domain, digital service and network slice management software product
Digital Operations Center enables a new slice-based innovation ecosystem and new revenue opportunities by offering Network as a Service capabilities to new industries, or verticals
Digital Operations Center is cloud-native, and built on Nokia’s Common Software Foundation to give scale, flexibility, and operational efficiencies
Source Reutter's

Nokia possible Inverse H&S coming upNokia has met nice resistance at $4.40 and now showing hidden bearish divergence on the weekly that if plays out could turn into Inverse H&S pattern. With the 1 trillion infrastructure bill being announced tomorrow we will see what happens. Could not play out but I think it will... the market doesn’t play fair for those taking positions at resistance for longs. I’m buying $3.5 Puts 7/10 like tons of them lol. If we break and close above the resistance on a significant time frame I’ll exit my position but I feel fairly good about it.


SHS pattern for NOKAs seen in the chart, I am predicting NOK to move down towards $3.34 before moving up again forming the right shoulder of the pattern, $4.52 seems like a resistance for NOK to move back down from. However, I am unsure of the time frame and duration it will take for NOK back to that price. Please put your comments below for me.

NOK. Local reverse pointNOK has reached the boundary of the downtrend, also it is near the highs of February 10 and near the strong support/resistance zone at $4.3-4.4. There was a strong gap up from the EMA200 . Locally, the paper is in the oversold area. There may be a correction to EMA200 ($4), but with favorable external factors and confirmation of downtrend break-down I see the growth to $5.1 . Price Targeting for the paper based on the estimates of 15 analytical teams at $4.75, and 6 analitics teams recommends it as StrongBuy

My idea FOR NOKIA CORPthe price is above the VWAP but we see a big volume with a candle with w good wick squeezed from top i guess the price will go short after it hit the FIBB RECTR line

NOK the time for the action?Even the NOK has some potential for growth in the days to come, primarily due to 5G steps the company is taking, at the moment this set up is SELL.
MA200 is as always strong resistance, and the RSI level is signaling a potential price reversal. In the case of 5% price drop, NOK is worthing taking under consideration for a long play.

NOK Long UpHere is another 5g stock idea...
We have been having a strong upward trend and since it is in this relatively new space it has the strong upward Potential!
World’s Fastest 5G: Nokia Beats Ericsson With New 5G Speed Record via @forbes www.forbes.com
They also have a relatively low market cap which if successfull could bring on a lot of investors...
Bought 850 at 3.92 USD

Bottom of RSI channel + Fib confluence in NOKIAHi everyone. Trying my hand at stonks again.,
Nokia is showing a number of potential reversal signals.
For starters, Nokia gapped down and held the 0.886 Fibonacci retracement from the July 2012 correction rally. After that rally, Nokia had what I believe to be an ABC retracement downwards, with a target for "C" being $2.42. This correction sequence in my opinion is very reminiscent to a 3-3-5 Elliott Wave correction. 3 Waves up, 3 waves down, 5 waves up which would complete the bullish correction. If indeed we are looking at a 3-3-5 bullish correction sequence, we are either on the very last, or close to the very last wave downwards for this asset. Next would in theory be a powerful 5 wave impulse upwards to complete the 5 waves of the 3-3-5 correction.
My opinion for the measurement of the "C" wave of this final 3 ABC series is located at $2.42. The local low so far this past trading week is $2.34. We can see that there was a fairly sizable bullish candle after touching the 0.886 and 1.618 "C" wave retracement. In the RSI, notice how the bottom of the channel was respected. This has also now printed bullish divergence in the weekly chart from late 2019.
With Fibonacci, we now know that we have a potential "C" wave having completed at $2.42, as well as a bullish 0.886 retracement at roughly the same price range. Confluence!
On the 30m, we can clearly see the reactions that were present when these levels were hit:
The daily is showing 4 tests of the 0.886 and 1.618 retracements. The weekly RSI channel on the daily is showing that we briefly dipped below support, but were able to re-enter back above both oversold and the channel support. There is some bullish divergence from the 12th of March. This has been accompanied by heavily increasing overall volume. Currently, price is showing a spinning top doji after breaking above a triple top. The price increased from bottom to top by 20%.
The Chaikin Money Flow indicator is showing consistent higher lows since late Oct 2016. These higher lows are accompanied by lower highs, which is in turn forming a symmetrical triangel. There are 3 touches of support and 3 touches of resistance so far. To validate a symmetrical triangle, rule of thumb is 3 touches each on both support and resistance. This will cause a very powerful move, whichever way it breaks. There is also a potential bullish falling wedge forming from Q2 2018. On this time frame we are only 3 points away from entering the accumulation portion of this indicator.
Weekly MACD is looking somewhat neutral. There have been consistent lower lows and lower highs since mid 2017. There is a flag-like channel the MACD has been following, similar to the RSI.
Interestingly, a very peculiar situation in the MACD histogram, however. There is a very strong bullish divergence in this recent drop versus the one that took place in November.
Like the weekly CMF indicator, there is a potential bullish falling wedge forming as well.
By the way. I did an analysis on Gold back in April of last year. Coming up on 1 year from the day I made it, gold is so far doing (almost) exactly what I thought it would. If Gold falls back down for a re-test of $1,350, it could mean that stocks are very near a potential bottom.
Gold is also printing a descending triangle, and is currently facing rather strong resistance in the RSI.
Consider how much fear there is in the market right now.
Consider how hard and how quickly we dumped, 35%!!! IN WEEKS!
The strongest and fastest drop in literal history.
Also keep in mind- Wuhan and mainland china are now peaking in CV19 cases.
And last but not least- just how many shorts and puts do you think there are?
nokia's have a wide reputation for being INDESTRUCIBLE.
This asset is literally screaming bull flags everywhere. wtf America?

NICE SETUP BULLISH ENGULFING #NOK PRIVATE EQUITY TRAKEOVERWith talks of Takeover by PE Firm KKR or BX or some other secret USA Player. 5G. Tech out for grabs. watch for possible gap on volume at open enter at high of pre market. no gap?
Enter on a 1min pull back if Volume is their....
Is Bitcoin going to follow Nokia's chart pattern?While evaluating Nokia stock I couldn't help but notice that Bitcoin could be following what Nokia's chart pattern did? What do you guys think leave comments below!


More downside - following the current marketExpecting more downside from current level/price. Possible entery Q2 - need confirmation on reversal.
