Arm Holding ,,, BreakoutUptrend
It was a good breakout of a major price level by a bullish candle. There is a multitouch ascending trend line, but I do not suppose it causes trouble for rising. Next target will be about 189 and as always set up a sure SL for your position based on your strategy. Good luck.
O9T trade ideas

$ARM stock ready for a move to upsideNASDAQ:ARM Stock is consolidating in a very tight range. Ready for breakout. Alert at $150


Head and Shoulder Look But....NASDAQ:ARM busting through this $152 area will negate that head and shoulders top look.
Wedging up on that right shoulder so not a breakout I would be interested to buy here. Just watching to see how this resolves and for #feedback

ARM LONG? SHORT?Follower requested ARM analyze! if you want also you can DM .
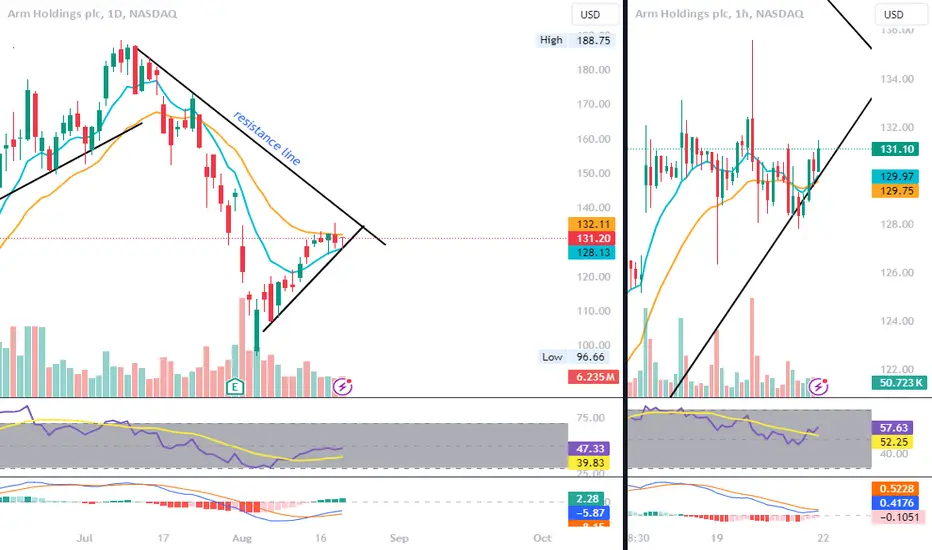
We are in critical point in the structure, where it determines if we are going up or down.
must watch closely in the upcoming week to see how it behaves below the line, if we retest the line again and fail we will go and retest the red area below 126-134.
And if the red line area fails-> we will be going lower and out structure would be in this case distribution.
Else we must see the price breakout of the upper line, it can continue up or retest the line.
SL BELOW 126$
TARGET 173$-187$
* will update if there is any change in sentiment of the structure
* for any question drop them below, and HIT THE FOLLOW BUTTON

ARM breakdown ARM
134.50 Short
132/128/125/120/115 can test soon
trendline breakdown possible
perfect bear flag

ready to go back to 120, head & shouldersThese are all overbought signals. There is nothing new in 10k; the catalyst does have a better outlook than some sector competitors. I'm watching the bearish move closely.

Broke out on area of resistance area for reversal 160No indication of a reversal, with good fundamentals, guidance, and work on growth. I don't think the catalyst of being turned down by Intel will have much impact; waiting for a sign to retrace.

ARM Short . US Stock122 below weak , already tl break
if yesterday low below sustain then very weak
121/119/116/114/112 target


ARM breaking out?On 24HR timeframe Arm closing out of box at 136.73 will continue 163.40 retesting that floor. Or we break 128 and continue down.


HTF Chart Analysis and Trade IdeasThese are strictly higher time frame analysis plays which you can execute on lower time frames by looking for the disproval of LTF algorithms.
Discussed in here are analysis of:
- UNH, PLTR, LEU, MAT, SHOP, ARM, AAPL
Hope this was helpful for all you TraderDaddy's!
Happy Trading :)

setting up a 145 H&S VERY possibleThere is room on the oscillators, and technicals indicate some slowdown. It could flush even more complex if it reaches 145-150 higher than targets.


WATCHLIST 8/25/24OPTIONS WATCHLIST 8/25/2024
NASDAQ:NVDA - Co to report earnings on Wednesday after hours. Huge call flow coming in last few weeks. Looking for calls above $130 for a move towards $136 and $140. Stock is strong on indicators
NASDAQ:MSTR - Stock up 12% on Friday with bitcoin moving higher. Looking for calls as long as stock holds 150 and bitcoin breaks 65k. Stock is strong on indicator level.
NASDAQ:ENPH - solar stocks on uptrend after Powell's comments on rate cut and future of economy. Stock broke above 50 EMA with next resistance at $135 as long as $121 holds.
NYSE:JPM - Stock broke all time highs on Friday as expected. Looking for calls above $220 for more upside. Banks stocks moving strong on rate cut comments by FED chairman
NASDAQ:ARM - Stock rejecting off of 50 EMA at $138. Stock seeing good call flow last week. Looking to add calls above $138 for a move towards $150 and higher. Stock is strong on indicator level

ARM - $132 break leads to $150ARM - stock saw some huge call buyer last week but failing to break and hold 21 EMA on daily time frame at $132.11. Stock is gaining strength on indicator level. looking for calls above $132.11 for a move towards $138 and $150,
125 testing the trendline then support at 118 (Daily)I may see some opportunities here, from a short to 118 to a high of continuing after a slight reset.

ARM: Approaching an inflection point. | 1H & D Chart Analysis |On the 1-hour chart, the price is moving within an ascending channel, marked by the two purple trendlines. The price has been consistently making higher highs and higher lows, indicating a strong short-term uptrend.
However, it’s currently approaching the lower boundary of the channel, which coincides with the 21-hour EMA. This area could act as double support, and a bounce from here might lead to another attempt to reach the upper boundary of the channel.
If the price breaks below the channel, it could signal a short-term reversal, leading to a potential test of the recent low around $97.76, which is its most important support level.
On the daily chart, after a significant drop, the price has started to recover. The 21-day EMA is still sloping downward, indicating that the broader trend might still be under pressure. What's more, thihs 21 EMA is acting as a resistance level for ARM, as it failed to break it last week.
Could ARM reverse the mid-term bearish sentiment? Yes, but it needs to break the 21 EMA (D) asap. If the price stays inside the ascending channel observed on the 1h chart, even better.
By turning bullish, the open gaps (yellow squares) will become our next targets.
Summary
Support Levels: Watch the lower boundary of the channel on the 1-hour chart.
Resistance Levels: The immediate resistance is at 21 EMA on the daily chart, with the upper boundary of the channel on the 1-hour chart also acting as a potential resistance.
We should be cautious of a break below the ascending channel, as it could indicate a short-term reversal, while a sustained move above 21 EMA on the daily chart could suggest a more prolonged recovery.
For more detailed technical analyses and insights like this, be sure to follow my account. Your support helps me continue providing valuable content to help you make informed trading decisions.
Remember, real trading is reactive, not predictive, so let's stay focused on the key points described above and only trade when there is confirmation.
“To anticipate the market is to gamble. To be patient and react only when the market gives the signal is to speculate.” — Jesse Lauriston Livermore
All the best,
Nathan.

ARM (Short-term bull run)NASDAQ:ARM
1st target: $140
Weekly chart: I see it move into the fair value gap and target to be in the box in this week or next.
2nd target: $158
Fib Retracement, 1st pull back is hit (yellow range). Once reached, $158, it is likely to do a correction. Then see whether the correction succeeds or fails.

ARM breakout If support holds and arm has a high chance of a breakout into a short term call. As seen before the head and shoulders pattern seems to have completed and arm is rebounding. Other indicators such as MA and MACD also indicated a bullish sentiment.


ARM on trendline and 61.8 retrace supportLet's see what this can buy us. If it can hold this level, and we get a nice sideways base, the upside is significant. what do you think?
