Oracle Shares (ORCL) Surge Over 11% to Record HighOracle Shares (ORCL) Surge Over 11% to Record High
As the chart shows, Oracle Corp. (ORCL) closed yesterday’s trading session above $155, and during the session, the stock even climbed above $160, marking an all-time high.
The bullish sentiment is driven by a strong quarterly earnings report:
→ Earnings per share were $1.39, surpassing the $1.33 expected by FactSet analysts.
→ Revenue rose to $13.31 billion from $12.45 billion, beating the forecast of $13.23 billion.
"With cloud services becoming Oracle’s largest business, the growth in our operating profit and earnings per share has accelerated," said CEO Safra Catz in a press release.
Investors reacted positively to news of Oracle’s partnership with Amazon Web Services and projections of accelerated growth in the company’s order backlog.
However, technical analysis of Oracle Corp. (ORCL) shares suggests the market might be “overheated.” This is indicated by:
→ The price's position relative to the linear regression channel, which started in 2022. The price is significantly above the upper boundary.
→ The RSI indicator entering the overbought zone.
This situation is reminiscent of June 2023, when the price rose above the upper boundary of the channel but failed to break $128, eventually falling back below the median.
It’s possible that the current optimism around the strong report could fade, and profit-taking might lead to a correction. In this case, Oracle Corp. (ORCL) shares could test a potential support area formed by the psychological level of $150 and the former resistance of $145, which may switch roles, as seen with the $128 level (indicated by the arrow).
This article represents the opinion of the Companies operating under the FXOpen brand only. It is not to be construed as an offer, solicitation, or recommendation with respect to products and services provided by the Companies operating under the FXOpen brand, nor is it to be considered financial advice.
ORC trade ideas

Oracle’s Earnings Growth & Amazon Deal Propel Stock to New HighsOracle Corporation ( NYSE:ORCL ) is riding a wave of investor optimism after posting impressive fiscal first-quarter results and announcing a strategic multicloud partnership with Amazon Web Services (AWS). This combination of strong financial performance and a game-changing collaboration has driven Oracle’s stock up nearly 9% in extended trading, marking a significant milestone in the company’s journey as a leading enterprise software and cloud services provider.
Key Highlights
- Earnings Beat Expectations: Oracle reported first-quarter revenue of $13.3 billion, up 7% year-over-year, surpassing analysts' expectations. Earnings per share climbed to $1.03, beating the previous year’s 86 cents.
- AI-Driven Cloud Growth: Oracle’s cloud services, its largest business segment, saw a 21% revenue increase to $5.6 billion, fueled by heightened demand for AI training models. The company’s Oracle Cloud Infrastructure (OCI) surged 45% year-over-year to $2.2 billion, a testament to the robust growth driven by AI applications.
- Amazon Partnership: Oracle announced a multicloud partnership with AWS, allowing customers to leverage Oracle database technology within AWS cloud data centers. This collaboration is expected to accelerate cloud adoption and drive further revenue growth.
Why Oracle is Soaring
Oracle’s financial strength is closely tied to its strategic focus on AI and cloud computing. With the rapid rise of AI large language models, Oracle’s cloud infrastructure has become a vital resource for companies looking to train these models efficiently. CEO Safra Catz highlighted a strong contract backlog, emphasizing the potential for sustained revenue growth throughout fiscal year 2025.
Additionally, Oracle’s partnership with AWS underscores its commitment to becoming a central player in the multicloud environment. By integrating with one of the world’s largest cloud providers, Oracle not only expands its market reach but also solidifies its position as a versatile and reliable cloud service provider, giving clients more flexibility and options for their data management needs.
The combination of AI-fueled demand and strategic alliances makes Oracle a compelling investment opportunity. Its impressive earnings growth and market adaptability suggest that the company is well-positioned to capitalize on the expanding cloud market, especially as enterprises increasingly look towards multicloud solutions.
Technical Analysis:
Oracle’s stock has been on a bullish trajectory, gaining over 34% year-to-date before Monday’s after-hours surge. The recent price action suggests a continuation of this upward trend, particularly with the stock breaking out of a well-defined trading range in mid-June.
- Short-Term Price Targets: Following the breakout, Oracle shares ( NYSE:ORCL ) defended a key level in early August before rallying over 11% from last month’s low. Technical analysis suggests a short-term price target of $154, calculated using the measuring principle that involves adding the height of the prior trading range to the breakout point.
- Critical Retracement Levels: Investors should watch for potential retracements to the $145 level, which previously served as resistance and may now act as support. This level will be crucial in determining whether Oracle ( NYSE:ORCL ) can maintain its upward momentum or if profit-taking could lead to a temporary pullback.
Future Outlook
Oracle’s recent performance and its expanding cloud business provide strong tailwinds. However, it’s important to consider potential risks, such as overbought market conditions and the possibility of a cooling-off period. The current rally has been fueled by euphoria around AI and partnerships, but extended upward trends without consolidation can lead to volatility.
The technical outlook remains positive, but investors should be mindful of the broader market environment and Oracle’s valuation. With the stock up significantly in recent months, any signs of slowing growth or competitive pressures could prompt a retracement.
Conclusion
Oracle’s blend of AI-driven earnings growth, strategic cloud partnerships, and technical breakout positions it as a standout performer in the tech sector. The multicloud deal with AWS is a game-changer that not only broadens Oracle’s market reach but also underscores its adaptability in a rapidly evolving industry.
While the stock’s current momentum is promising, careful monitoring of key technical levels and fundamental developments will be essential in navigating Oracle’s next move. As the company continues to innovate and expand its cloud offerings, it stands well-positioned to capitalize on the growing demand for AI and multicloud solutions, potentially driving further gains for investors in the months ahead.

Oracle Liquidation - Short or Sell | Yellowstone Bubble Anyone?Awhile back I posted a chart, where I referred to this current market as the "Yellowstone Bubble".
Lol at the time, I was simply teasing about how ever since roughly season 4 of the show Yellowstone , it seems like everyone thinks they are some kind of tough-guy money-making, all-powerful market wizard.
Google: "Yellowstone Oracle".
Anyway, there's not much else to say here. The internet is a commodity.

Oracle (ORCL): Bullish Outlook Ahead of EarningsToday, we’re getting the earnings report on ORCL, and we’ve had to adjust our last analysis accordingly. We are now looking at a more bullish scenario after our previous bearish outlook was invalidated. If Oracle holds the desired level, we believe our current wave count is accurate.
The count is pretty straightforward, and we think we’re now in the intra wave (ii) of the larger wave 3. This wave (ii) might touch the trend channel again, though it doesn’t necessarily have to. The channel seems accurate as waves ((i)), ((ii)), and ((iii)) are all tagging it. It would have been ideal if wave ((iv)) had touched it as well, but perfection is rare in markets.
We’re focusing on the area between $133.43 and $129 to hold. We’re not setting any limit orders for ourselves just yet, as we want to see if our new count proves correct before making any moves.

ORCL 4hr Long Buy Stop💹 Stock:
📈 4hr Long Buy Stop
🎯 BUY STOP - 140.78
💵 TAKE PROFIT - 146.54
🔴 STOP LOSS - 138.86
⚠️ Reminder: If price trades below the 10ema remember to cancel/close your buy stop position.


$ORCL The Matrix OracleNow that you have grasped the basic knowledge of the Matrix and its blueprint being conceptually Math, here we are diving towards the horizon which is the future trying to make sense of the math of the path. That lies ahead of us.
Extracting the information required to navigate into the unknown which is the future which might have already happened, we don't need to understand our choices, or the cause of our choices, we don't even need to accept the effects of the causes that lie beneath the fabric of the Universe which is a Matrix. All we need to do is get some more views into my ideas because the math behind it might suggest that we are living in a block Universe and the Future is The Past. For the Aliens that Have conquered. A Black Hole. Nen.
Not financial advice, but all rectangles and elements are projected simulated potential support/resistance. Looking forward to see if this conceptually math idea nen project resembles or makes sense even for the untrained eye, taking into account the price action that will follow after its inception.
The Inception of the idea that everything is math and it all comes down to probabilities and potentials, doesn't need you to believe or see or understand. Your Subconscious might see it all in a fraction of a second of computational awesomeness that uses only 20watts to function, which is your brain.
Good luck!

Oracle, a quiet emerging major AI playerNYSE:ORCL is quietly becoming a major player in the AI revolution, driven by its AI partnerships and expanding data center infrastructure. With rapid growth in its cloud business, Oracle is transforming into an AI powerhouse, offering significant upside potential for investors. The company's strong financial performance and strategic deals with firms like OpenAI position it for continued success.
As for the technicals, Oracle is currently trading at $133.28, having dropped by 3.08%. The stock is moving within a rising channel but has recently dipped below its 50-day moving average, which could signal short-term weakness. The MACD shows a bearish trend, indicating potential downward momentum. Investors should watch for support around $130 and resistance near $140.

ORCL: Pay Attention to These Key Points! (D / W charts)The ORCL chart displays notable patterns and key levels on both the daily (1D) and weekly (1W) timeframes, offering insights into potential trading opportunities.
On the daily chart, ORCL is forming a possible double top pattern around the $145.32 resistance level, indicating a potential bearish reversal. The double top is a classic bearish pattern that occurs after an extended uptrend, and it often signifies that the asset may experience a decline. The confirmation of this pattern would be a break below the trigger point at $137.56, which could open the door for further downside. As long as the price stays above this key point, the bearish thesis won’t materialize.
Additionally, the daily chart shows a price gap that occurred in mid-June, suggesting a strong bullish move that pushed the stock significantly higher. However, the recent formation of the double top pattern near the $145.32 resistance level implies that the bullish momentum may be waning. The 21-day EMA has been providing dynamic support and will be a critical level to watch. A close below this EMA could signal further bearish pressure.
On the weekly chart, ORCL's long-term uptrend is evident, supported by a rising trendline that has been intact since October 2022. The stock has been riding above the 21-week EMA, indicating strong bullish momentum over the longer term. However, the recent candlestick pattern shows signs of potential exhaustion as the price nears the $145.32 resistance level, which aligns with the double top seen on the daily chart.
The weekly chart also highlights a key support level at $127.54, which coincides with the rising trendline and the 21-week EMA. This support level will be crucial in determining the longer-term direction of the stock. A break below this level could signify a trend reversal, while a bounce off this level could reinforce the ongoing uptrend.
In summary, ORCL is at a critical juncture with a bearish double top pattern on the daily chart and signs of potential exhaustion on the weekly chart. The key levels to watch are the $145.32 resistance and the $137.56 trigger point on the daily chart, along with the 21 EMA on the daily chart. A break below the trigger point could confirm the bearish reversal, while maintaining above the support could sustain the longer-term uptrend.
Remember that the trend is bullish, and any pullback should be considered as another buying opportunity. Trends persist until a clear reversal occurs (Dow Theory, tenet #6)
For more detailed technical analyses and insights like this, be sure to follow my account. Your support helps me continue providing valuable content to help you make informed trading decisions.
Remember, real trading is reactive, not predictive, so let's stay focused on the key points described above and only trade when there is confirmation.
“To anticipate the market is to gamble. To be patient and react only when the market gives the signal is to speculate.” — Jesse Lauriston Livermore
All the best,
Nathan.

ORCL Rejection - Price Precedes NewsORCL had been running up recently into the previous ATH, but broke below the ascending channel it was in. It recovered some and went back for another test of ATH. Of course when it got there, this news drops.
The dump was happening either way. Price precedes news.

ORCL, out of steam?ORCL presents a contrarian trading opportunity. Despite overall bullish sentiment, the price action suggests a potential downside. ORCL recently hit an all-time high but closed lower, indicating possible bearish momentum. With QQQ breaking out and major tech stocks like NVDA, AAPL, GOOGL, and MSFT showing significant growth, it's plausible that these leaders might consolidate as the market catches up. ORCL appears poised for this consolidation phase, making it an optimal candidate for a short trade based on its recent price movements and market dynamics.

Oracle introduces new AI breakthrough for corporate software devThis week, Oracle Inc. introduced an important artificial intelligence (AI) innovation aimed at the most popular AI field: corporate software development. Oracle expects this product to drive profitable sales, distinguishing it from most mass-market AI services.
The introduction of the new solution, Oracle APEX AI Assistant, is set to revolutionise the way enterprise programs are created. This innovative tool eliminates the need for extensive source code, significantly reducing development time and costs. In fact, APEX AI Assistant allows enterprise applications to be deployed 20 times faster and to write 100 times less code than traditional tools.
Given these developments, let's examine the Oracle Inc. (NYSE: ORCL) shares from a technical analysis perspective for potential trading opportunities.
On the Daily (D1) timeframe, resistance at 140.95 USD was broken through, and support has formed at 137.40 USD. Quotes have left the broad sideways channel, in which they have been trading since June 2023. In the event of a downward trend, the target for the fall may be set at the level of 122.50 USD.
If the upward trend continues, the short-term target could be set at 155.00 USD upon a rebound from the resistance at 140.95 USD. In the medium term, the price may rise to 168.00 USD.
__
Ideas and other content presented on this page should not be considered as guidance for trading or an investment advice. RoboMarkets bears no responsibility for trading results based on trading opinions described in these analytical reviews.
The material presented and the information contained herein is for information purposes only and in no way should be considered as the provision of investment advice for the purposes of Investment Firms Law L. 87(I)/2017 of the Republic of Cyprus or any other form of personal advice or recommendation, which relates to certain types of transactions with certain types of financial instruments.
Risk Warning: CFDs are complex instruments and come with a high risk of losing money rapidly due to leverage. 69.88% of retail investor accounts lose money when trading CFDs with this provider. You should consider whether you understand how CFDs work and whether you can afford to take the high risk of losing your money.

ORCL Long-Term Bull, ignore the noise from CRM and MDBJust a few days ago, ORCL was WS's darling. But suddenly, CRM software revenue was missed, vital guidance was absent, and Database MDB's soft earnings were lost in this high-expectation environment. Then, the macro environment around rates and inflation was ongoing.
All this is noise; ORCL is turning into a mini Microsoft, a cloud and Software company. Its cloud segment will shadow everything else.
My target is 140 by July and August, but before that, it can test 105 in the worst-case scenario. Please consider the validity of my other ideas so far in the recent timeframe.
Disclaimer: I am on the Call for July 130, a long, cheap contract.

6/11/24 - $orcl - not best reward for risk in this tape. pass.6/11/24 - vrockstar - NYSE:ORCL - literally wrote this prior to the last quarter (when i wasn't publishing publicly) and not much has seemed to change:
seems fairly valued all else equal "uninteresting" at current levels which implies 10 bn FCF discounted at 3% which seems to be about the norm for above average software. i'd be more interested at the 4-4.5% level which implies a reasonable downside from here otherwise have better horses
what's new? it's not a mag 7. when you divide "ORCL/QQQ" - you go back to the 90s! in other words, it's not really been the best nasdaq horse. is it still relevant? yes. is there still potential in the "data centers and data aggregators etc. are the new hot thing" - yes. i'm not an anti-ORCL stonker but for 10% EPS growth? what am i paying for scale (yes scale) here? 20x? most? 2x PEG. this isn't 15%, it's not 20%, it's 10%. 20x on $5.5 of EPS power puts you a bit above $100. so while the recent quarter was a pop and stick - you didn't get much more run. i don't see the value of necking out on this one if you're looking to outperform the index. i'd either go even lager in cap or something that's smaller i've written about in software, NYSE:YOU , NASDAQ:NICE , NYSE:S , even NYSE:IOT (which you'll pay more for - but has great LT legs).
conclusion: dip buy this, don't bet on the breakout and rip higher in the current tape - it's too much risk vs. return. i'll probably short the stock if we find ourselves in the mid 130s (as a funding for longs I like). otherwise i wish you the best if u own it no hard feelings. :)
take care today fam
V

Oracle (ORCL): Bearish Scenario with Long-Term PotentialSince our last analysis of Oracle on the daily chart, there has been little significant change. The stock moved into our Wave (B) zone between $128 and $138, and after reaching a high of $132.77, it was rejected. A trendline was broken but quickly reclaimed, suggesting a potential push upward.
We anticipate Wave 3, the subordinate wave, to find support around $91 to $86. Currently, everything indicates a falling trend, and unless the price rises above the recent high of $132.77, we expect continued downward movement.
However, our primary scenario remains bearish, expecting a further sell-off down to the range between $80 and $50. This range is broad but suitable for long-term entries. We see no issue with the size of this target zone, as it offers good long-term potential.

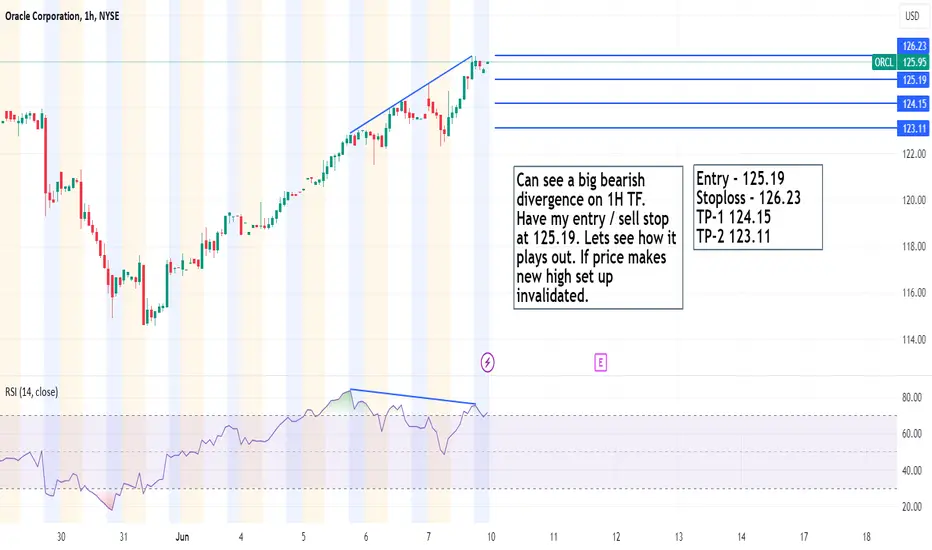
Oracle Corp - Short SetupCan see a big bearish divergence on 1H TF. Have my entry / sell stop at 125.19. Lets see how it plays out. If price makes new high set up invalidated.
Entry - 125.19
Stoploss - 126.23
TP-1 124.15
TP-2 123.11
ORACLE Gann analysis
up cycle end at 199.34
now must thrust above 120.09 oterwise it goes down to correct to 103.39

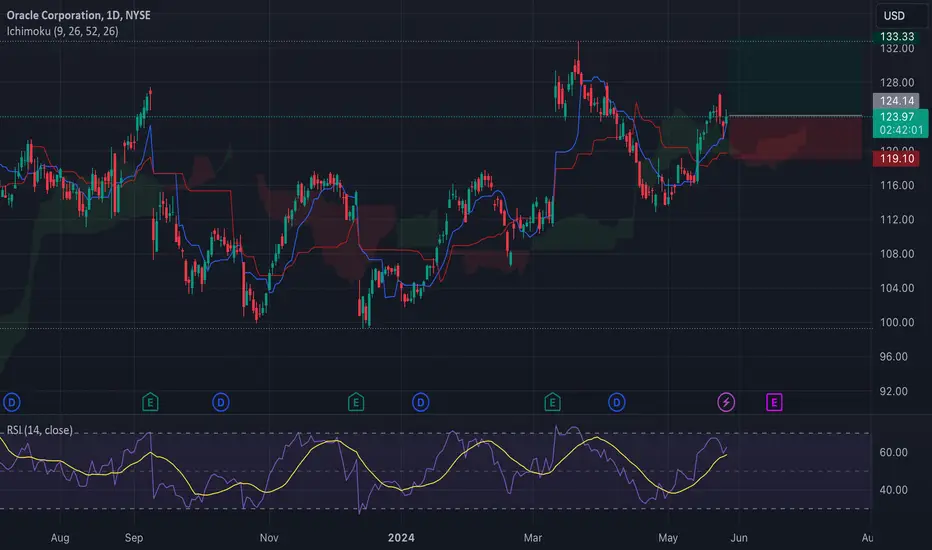
Expert Analysis Predicts Massive GainsOracle Corporation's stock is exhibiting strong bullish characteristics supported by multiple technical indicators. The trend, supported by moving averages, RSI, MACD, and Ichimoku Cloud, indicates further potential for upward movement. The recommendation is to enter a long position with the outlined targets and stop-loss levels, capitalizing on the bullish momentum.
Price Prediction: Based on the current analysis, Oracle Corporation's stock could reach $133.38 in the short term, with the potential to move towards $148.59 if the bullish momentum continues.
Long Position: Enter a long position at the current price level of $124.13. The target price is $133.38, with a stop-loss set at $119.00 to protect against downside risk. This stop-loss is placed just below the 20-day SMA, which acts as a strong support level.
Short Position: A short position is not recommended at this time due to the prevailing bullish trend. However, if the price drops below $119.00, consider shorting with a target price of $108.36 (S1), and a stop-loss at $123.00.
ORCL Partnership With X.- Long IdeaElon's.X.announced plans to create a super computer with Oracle. I've been watching ORCL.for a while now expecting a breakout, but every attempt to.make.a new ATH.has.gotten stuffed quickly. Not sure if this news will have a big impact on ORCL or not, but it's worth watching if it does breakout here after several hard rejections.

ORCL on their wayPrice is creating an expansion wave for wave 5, still keeping the 150 target slowly and steady, I missed that pump of 8 point in one day with the news coming from tesla partnering with ORCL, but well I cannot cover all fronts.

Oracle's $10B Deal with Elon Musk's xAI Signals Cloud GrowthOracle Corporation is poised for substantial growth in its cloud computing sector through a potential $10 billion deal with Elon Musk's AI startup, xAI. This strategic partnership signals Oracle's emergence as a key player in the generative AI market, positioning its Oracle Cloud Infrastructure (OCI) division for significant expansion against competitors like Amazon Web Services and Microsoft Azure. Despite recent stock price fluctuations, Oracle's cloud revenue has surged, bolstering confidence in its cloud computing capabilities. The connection between Oracle's Chairman Larry Ellison and Elon Musk further underscores the promising prospects of this collaboration, with xAI likely becoming a flagship client for Oracle. This partnership promises to advance AI cloud services and could lead to groundbreaking developments in the industry.

Elon Musk's xAI Set to Rent Oracle's AI Servers for $10 Bln Oracle Corp. ( NYSE:ORCL ) is close to a $10 billion cloud contract with Elon Musk's artificial intelligence startup, xAI. Oracle Chairman Larry Ellison announced last September that the company had a deal to provide cloud infrastructure to xAI to train artificial intelligence models. The talks are ongoing and there is no guarantee that the two companies will reach an agreement. XAI was set to close a $6 billion funding round, valuing the company at about $18 billion. The shares gained 3.7% to $120.68 in New York after earlier hitting $122.55. The stock has increased 10% this year through Monday's close.
The deal would make xAI one of Oracle's largest customers, as Musk looks to raise funds for xAI in an attempt to rival the AI offerings of OpenAI and Google. The cloud negotiations are ongoing and there is no guarantee that the two companies will sign a deal. XAI was reportedly in talks to raise $3 billion in a round last month, which would have valued the company at $18 billion. Oracle and Elon Musk did not immediately respond to Reuters requests for comment.
Oracle ( NYSE:ORCL ) released an update to its database technology earlier this month intended to make it more useful with AI. XAI is the largest H100 customer at Oracle, using more than 15,000 of the AI chips, which are made by Nvidia. Last month, Musk said xAI would launch an enhanced version of its chatbot Grok to early testers and existing users on his social media platform X.

Update On ORCL Pullback Still Looking GOODIt took a while the overall market was determining its direction last week. These positions including JPM are now starting to play out nicely.
