DAL- Here is a REVERSE signal in the making ProfitFromPricesLooks like it is about to resume the trend. This time to make a new recent High. I am IN.
OYC trade ideas

Delta Airlines still has a long way to fallJust bounced off again from the higher trend line, overall EMAs look to be heading south, could be a 15% move over the next couple of weeks


Delta DAL- Is it time to get long..for nice long profit?I think today is a perfect day to take some long positions in airline stocks. Today's pattern has a higher bottom and a nice RESTART signal! I am thinking to go long with a stoploss at today's low of $34!

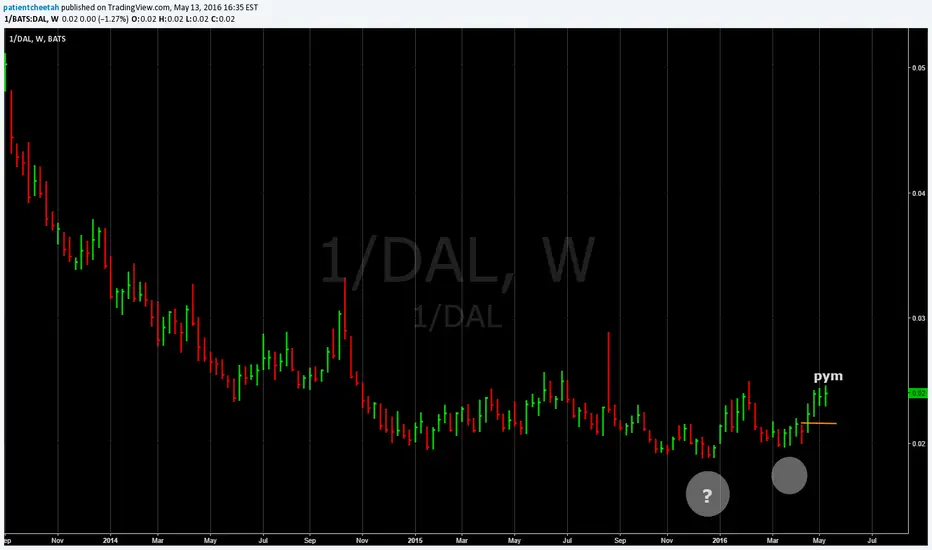
DAL large breakout imminentDAL has just dropped 20% in 2016 and is expected to rise as much as 79% in the next year.
It is already going back up. And according to the resistance level drawn, it is very likely to repeat itself as it had in 2015.
Check out the analysts outlook www.marketwatch.com


another take off? this week I am watching Delta Air $DAL because they are reporting earnings on Thursday, We have talked about this two months ago. Not much has changed since Delta Air $DAL was back in the $40.48 rage and pop back up to $46-$53 rage. My prediction is Delta Air $DAL will move on earnings, I don’t know how traffic has been , but Oil has been a friend to the airline but Delta Air $DAL is trading at six times, I really interested to see how traffic been.

DAL - Sell Signs?Showing trends in 1 year chart.
Note - this is my opinion and not an intended trade suggestion. I am a chart novice. Any feedback is always appreciated!

Pretty bad right nowSame thing for Delta airlines but this is not moving fast to $38 I am a little airy about this stock I’m not a buyer price target is $38


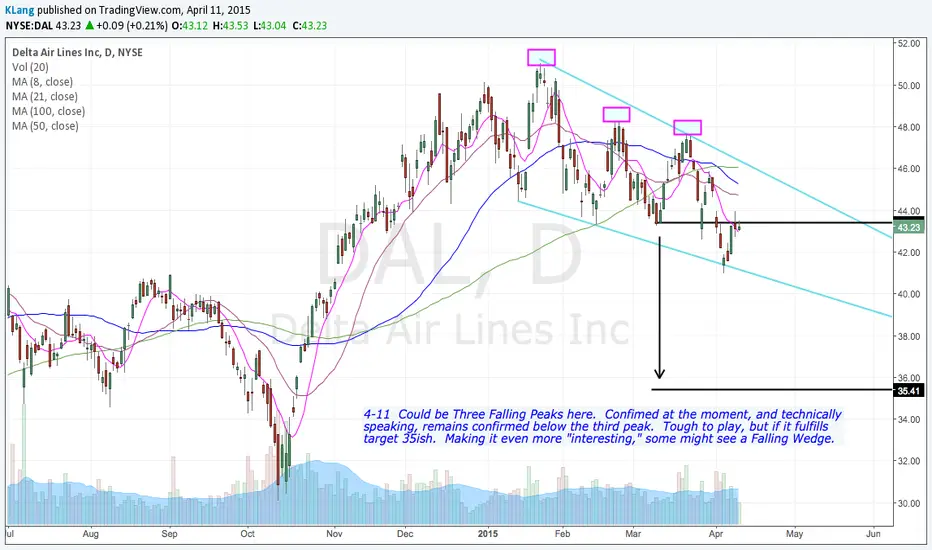
Delta Air Lines Inc - DAL - Daily - Descending below key averageRolling over again, now breaking the 253 (1 year) day moving average after testing it in April and again in May... The 66 day (1 quarter) moving average is pointing down and the price is rejecting it on the last rally. 41 is the level where the least amount of trading has occurred in DAL shares, so that means this is where buyers are supposed to be. I think, however, that the buyers are already "IN" the stock and we can see a slow bleed from this level and grind down to the 36-33-30 level over the next 6-9 months. If Walmart is rolling over, so will Delta. Walmart leads the way. If anything, consider going long Walmart (very cheap in this recession) and short Delta.
Be prepared to sell short on rallies back to 41-42 after a push down to $39.50 support (from high volume - see volume profile on right side of chart). Stop loss levels are 44 and 45. 42-43 is the lowest risk level to sell short with the tightest stop, but the safest trade is when DAL is falling and weak since it is more likely to trigger stops and keep falling. So, ideally we want to push through 41 and get down to 39.50 and have a bounce, then reject 41 and push down through 39.50 to set up the move to 36-33-30. Updates to follow.
Tim DAL 41.45 last 10:40AM EST June 8, 2015

Delta Airlines -DAL - Weekly -Touched 1x's sales in 2014Delta is just off of an extreme level of valuation as it backs down to $43.36 today, May 22, 2015.
If you look at the Total Revenue chart, you can see that revenue gains were steady and have increased by 42% since 5 years ago in May. Over the same time frame, however, the stock price has risen by 267%. After-tax margins went from losses to profits and margins briefly climbed over 20% (after-tax).
Next questions: Did DAL use up all of their tax-loss carry forwards? Will the drop in oil prices lead consumers to spend more on travel? Will people fly on vacations more or will driving still be the best choice.
DAL has been a monster winner for any portfolio up until now, but Airlines are a cyclical business and the business cycle hasn't been outlawed. Consolidation and efficiencies have driven up profitability, and shareholders have been richly rewarded. It looks like there are more "shareholders" than "share-buyers" at this level and the recent price action is alerting us to sellers unloading shares. $46 seems to be the common price where the sellers are unloading shares and the strong buyers are down at $34-$30. So, from $43.30 here, the upside seems less than the risk to the downside.
Here's hoping you look at the fundamentals too when you examine a chart and not just the "technimentals"....
Cheers,
Tim 5/22/2015 2:02 PM EST 43.31 last DAL
PS - Note - I have been picking a top in DAL over the past year +. Check out my charts.

Buy fear, sell greed... Mmm airlines in general flat YTD. Anyhow buy volume on D1 Charts show bids averaging above their daily volume which tells me that there was short selling profit taking, but more importantly that there was a large amount of bidders buying the dip forming the long legged doji at support. If we look at todays derivatives action you can see the largest bidder loading up on 6,958 SEP 15 48 Calls at 1.70 (Delta .35 / IV 31.62% / Open Interest 57,412) . So all in all, I'm looking to be long the stock. Current fast Beta is at 1.21.
Support: 40.90 - 42.60 (If broken it would invalidate the trade) , do note 200 Moving Average support (I'm not alarmed by price dipping below the moving average due to previous strong recoveries after price dipped below).
Resistance: 47.40 - 47.96 (Use your own discretion on where to take profits)
Update: I have not entered long yet, will wait until next week to decide on whether I'll enter or not.
Cheers =)

DAL Testing Upper Trendline If this Upper Trend line breaks Look to go long. If it Fails look to go short to that 42 level. Momo 90 RSI for the year. I only play Liquid stocks. Out-performers.

DAL: Invert H&S On the DailyI have identified a potential inverted head and shoulders pattern developing in Dal. Pattern is confirmed when price closes above the neckline. Target can easily hit 52, but a more conservative target would be just below the high in case of double top formations.
Why I like this trade:
1. Dal, along with the rest of airlines have reported strong earnings.
2. As of yesterday, Oil has put in a topping signal (for now)
3. Dal is within 1/3 of its' high of 51 making this patterns breakout even stronger.
Have a chart that you would like a second opinion on? Comment below and I'll take a look!

DAL Day Trade PatternHere I point out a "W" trading pattern that could indicate the short term downtrnd can be reversing. W pattern will be confirmed if DAL can hold 45.5 on the next pullback. Excellent risk reward here.


DAL is always on my radar screenTransports lead historically. See weakness in every indicator here. You decide.
