PEP trade ideas

About to short PEPPep just hit my major resistance zone. If i see confirmation tomorrow, I'm shorting it. It might break above my zone and become support where then i will wait for a retest and go long after a confirmation.

PEP is bullishDivergence between Price and MACD, have potential to rebound to its resistance at 182.63 (upside 3.5%)
MACD starts going up, trend line has been penetrated.
Disclaimer:
The information and recommendations provided are for informational purposes only and should not be considered as financial or investment advice.

Stocks pairs trading: KO vs PEPI'm exploring a pairs trading strategy involving two behemoths in the beverage industry, Coca-Cola (KO) and PepsiCo (PEP). Both companies are well-established and share numerous similarities, yet there are subtle differences that could offer a trading opportunity. The idea is to go long on Coca-Cola and short on PepsiCo, aiming to capitalize on their reversion to a historical relationship.
Why Go Long on Coca-Cola (KO):
Valuation: Coca-Cola has a lower P/E ratio of 24.11, making it less expensive relative to PepsiCo with a P/E of 30.57.
Dividend Yield: Coca-Cola offers a higher dividend yield (3.15%) compared to PepsiCo's 2.87%. Over time, reinvesting these dividends could provide an edge.
RSI Indicator: The RSI for Coca-Cola is 26.68, which falls into the 'oversold' territory, suggesting potential undervaluation.
Liquidity: With a Quick Ratio of 1.00 and a Current Ratio of 1.10, Coca-Cola displays better short-term financial stability.
Why Short PepsiCo (PEP):
Valuation: PepsiCo's higher P/E ratio of 30.57 suggests it is overvalued relative to Coca-Cola.
Recent Performance: While PepsiCo has performed better recently, the pairs trading strategy relies on a reversion to mean, making this an opportunity to short PEP.
RSI Indicator: PepsiCo has an RSI of 39.66, which is neither oversold nor overbought, but higher than Coca-Cola's, implying less likelihood of being undervalued.
Decision:
Long on 3 KO
Short on 1 PEP

PEPSICO August 1st, 2023Based on the weekly chart analysis, Pepsico Inc. ( NASDAQ:PEP ) has been on an overall uptrend, with rising prices supported by observations from the stochastic oscillator. The price has formed a rising wedge pattern. However, it is essential to note that the price has already breakout of the resistance area within the rising wedge pattern, but there is still a tolerance level until the price breaches the macro resistance marked by the dotted line.
Currently, the price is trending downwards, which is supported by the presence of an evening star candlestick pattern. An evening star pattern consists of three candles: a large bullish candle, followed by a smaller indecisive candle, and finally a large bearish candle (need confirmation on closing price this week). This pattern suggests a possible reversal in the ongoing uptrend.
The stochastic 5,3,3 oscillator has shown a crossing in the overbought area. Looking historically, a similar occurrence in the past has resulted in bearish price movements until the stochastic reaches the oversold area. This implies a potential bearish trend in the coming days or weeks.
The downside target is approximately 180.37. That the price is expected to decline towards this level before potentially finding support or stabilizing. Traders may use the oversold stochastic condition as a signal to take profits or consider buying opportunities, as historically, such conditions have led to an increase in price after the oversold level is reached.
Overall market conditions and any significant news related to the company could influence the price movement. After reaching the downside target, there is a possibility that the price may start increasing again, but further analysis will be required at that point to assess the potential direction.

$PEP Long Trade IdeaEntry: 175 (finding support at trend line)
Stop: 174
Take Profit 181 (at 200 EMA)

Pepsico Inc - PEP (Long)Pepsico Inc
Long
Enter: 177.27
Take Profit: 192.00 (8.23%)
Stop Loss: 174.09
R:R Ratio: 4.41
Chart is bouncing of a parallel channel

PEP likely to go up.PEP has bounced today from the first support level of 182. It is also holding 200 EMA. Squeeze momentum indicator doesn't have dark red bars yet. If one appears in the next couple of days, it will confirm that bullish momentum is building up.

Plan Stock PEPSICO 16/08 - 01/09The three major US stock indexes opened lower, with the Dow down 1.01%, the Nasdaq down 1.1% and the S&P 500 down 1.1%. VinFast, the Vietnamese electric vehicle maker, is up more than 254% and its market value soars to $86 billion, making it the fifth largest auto stock in the world.
Most major European stock indexes closed, with Germany's DAX30 down 0.86%, Britain's FTSE 100 down 1.57% and Europe's Stoxx 50 down 0.96%. .

S&P500 Earnings Dashboard (Confirmed vs Estimates)
Good news are bad news...
I am building a personal dashboard about earnings from S&P500 Index
Here the version 0.1 with the first 20 stocks, other stocks coming soon:
www.tradingview.com
More than half of stocks beat the estimates, this is a good news....
How the dashboard works:
1. Each cell contains the ticker and the percentage of outperforming or not the estimate
2. Further statistics in the table headline, such as how many stocks are beating or not the estimates and how much.

Pepsi is bullishDividend stocks like Pepsi can be viewed by many as a defensive stock in a market that's looking to correct, or if a recession is on the horizon. This pullback was expected, but I expect to see 190+ from here.

Bullish Alert : PEP15 minutes chart,
Possible game-over for this small pullback.
New bullish Alert followed by bullish crossover and positive test on the ema 50

PEP (PEPSI) long on pullbackThis could be a short term uptrend, which we are planning to capitalize on. Although first there should be a minor pullback for a good rr trade setup.

PEPSICO Testing Lower Highs. Strong buy if broken.Pepsico Inc (PEP) has been trading within a Channel Up pattern for more than 1 year. Currently it has been rejected on the internal Lower Highs trend-line from the May 15 High. As you can see within this Channel Up, every time the price tested such Lower Highs (3 occasions), it had an initial rejection (twice to the 1D MA50 (blue trend-line)) and then broke out. On all occasions, it hit the dotted Higher Highs trend-line, just below the top of the Channel Up. The 1D RSI is on a similar pattern with all those past fractals.
As a result, we will be ready to buy after it breaks above the Lower Highs and target the dotted trend-line at 200.00.
-------------------------------------------------------------------------------
** Please LIKE 👍, FOLLOW ✅, SHARE 🙌 and COMMENT ✍ if you enjoy this idea! Also share your ideas and charts in the comments section below! **
-------------------------------------------------------------------------------
💸💸💸💸💸💸
👇 👇 👇 👇 👇 👇

$PEP with a bullish outlook following its earnings #StocksThe PEAD projected a bullish outlook for NASDAQ:PEP after a positive under reaction following its earnings release placing the stock in drift A with an expected accuracy of 92.13%.

PepsiCo (PEP)Shares in PepsiCo, Inc. (symbol ‘PEP’) had been rallying through most of the second quarter of the year, only to revert to the downside around the middle of the quarter. The company is expected to report earnings for the quarter ending June 2023, on Thursday, 13 July before markets open. The consensus EPS is $1.95, compared to $1.86 in the same quarter last year.
“PepsiCo’s current ratio for the three months to 31 March 2023 was 0.87 (87%). This indicates that the company is not able to repay its short term liabilities with the current assets in hand, making it a not-so-safe addition in investors’ portfolios,” says Antreas Themistokleous, an analyst at Exness.
“The debt-to-equity ratio for the first quarter was 2.18, against an industry average of around 2.5. This shows the company is well positioned in terms of debt in relation to industry the average, and is not at high risk of liquidity/borrowing issues.”
Technical analysis shows the price has been trading in a slightly inclined channel for the past month while the 50-day moving average is trading well above the 100-day moving average. This indicates that the overall bullish momentum has yet to shift, despite the big correction in mid-May.
The Stochastic oscillator is not recording any overbought or oversold levels, signaling that the price could move in either direction - with no clear indication as to what that might be. $182 and $188 represent the technical support and resistance levels respectively, coinciding as they do, with the 50% and 23.6% daily Fibonacci retracement levels.
Shares in PepsiCo, Inc. (symbol ‘PEP’) had been rallying through most of the second quarter of the year, only to revert to the downside around the middle of the quarter. The company is expected to report earnings for the quarter ending June 2023, on Thursday, 13 July before markets open. The consensus EPS is $1.95, compared to $1.86 in the same quarter last year.
“PepsiCo’s current ratio for the three months to 31 March 2023 was 0.87 (87%). This indicates that the company is not able to repay its short term liabilities with the current assets in hand, making it a not-so-safe addition in investors’ portfolios,” says Antreas Themistokleous, an analyst at Exness.
“The debt-to-equity ratio for the first quarter was 2.18, against an industry average of around 2.5. This shows the company is well positioned in terms of debt in relation to industry the average, and is not at high risk of liquidity/borrowing issues.”
Technical analysis shows the price has been trading in a slightly inclined channel for the past month while the 50-day moving average is trading well above the 100-day moving average. This indicates that the overall bullish momentum has yet to shift, despite the big correction in mid-May.
The Stochastic oscillator is not recording any overbought or oversold levels, signaling that the price could move in either direction - with no clear indication as to what that might be. $182 and $188 represent the technical support and resistance levels respectively, coinciding as they do, with the 50% and 23.6% daily Fibonacci retracement levels.

PEP PepsiCo Options Ahead of EarningsIf you haven`t bought PEP here:
or sold it here:
Then analyzing the options chain of PEP PepsiCo prior to the earnings report this week,
I would consider purchasing the 180usd strike price Calls with
an expiration date of 2023-7-14,
for a premium of approximately $0.75.
If these options prove to be profitable prior to the earnings release, I would sell at least half of them.
Looking forward to read your opinion about it.

Bullish Alert : PEPHourly Chart.
Possible 1-2 after the most recent bullish alert which came together with a bullish crossover.
The wave structure is looking bullish as well.
Waiting for a bullish action of the price to confirm the setup.

$PEP with a bullish outlook following its earnings #StocksThe PEAD projected a bullish outlook for NASDAQ:PEP after a positive over reaction following its earnings release placing the stock in drift B with an expected accuracy of 60%.

PEP to 88PEP has a support at 180.54
Therefore we are waiting a trend change.
Entrance at 184.20 Dotted line
SL= Below but close to 180.54 (support)
Take profit= 188.68 (Fibo retrachment at 50%)
You can stay even above 188.68, always managing your risk!

PEP Entry, Volume, Target, StopWhen price clears: 196.88
With daily volume greater than 2.95M and greater than 20 day average.
Target: 208 area
Stop: Depending on your risk tolerance; 193.19 gets you 3/1 Risk/Reward.
This swing trade idea is not trade advice and is strictly based on my ideas and technical analysis. No due diligence or fundamental analysis was performed while evaluating this trade idea. Do not take this trade based on my idea, do not follow anyone blindly, do your own analysis and due diligence. I am not a professional trader.

PEP LONG IDEABuy at last resistance turns support area
Pink line SL
Blue Line first tp, can take 2/3 and let 1/3 run.
Move SL to entry price if price goes to blue line

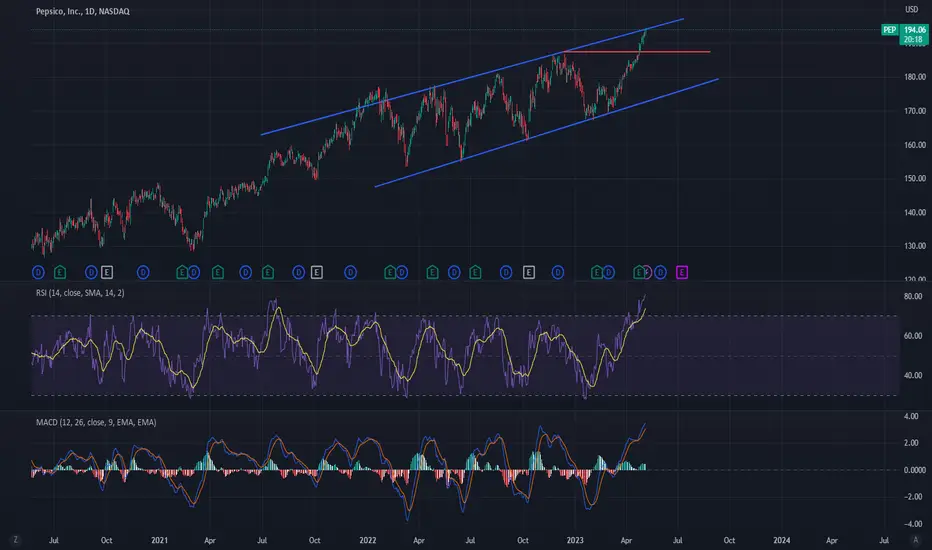
PEP: Support and resistancePEP is at major resistance, mostly it will come down to the red line.
This stock respects the analysis.
RSI is over heated, stock is at ATH, economic conditions are not good.
So, I expect it to correct to the red line in few weeks.
NASDAQ:PEP