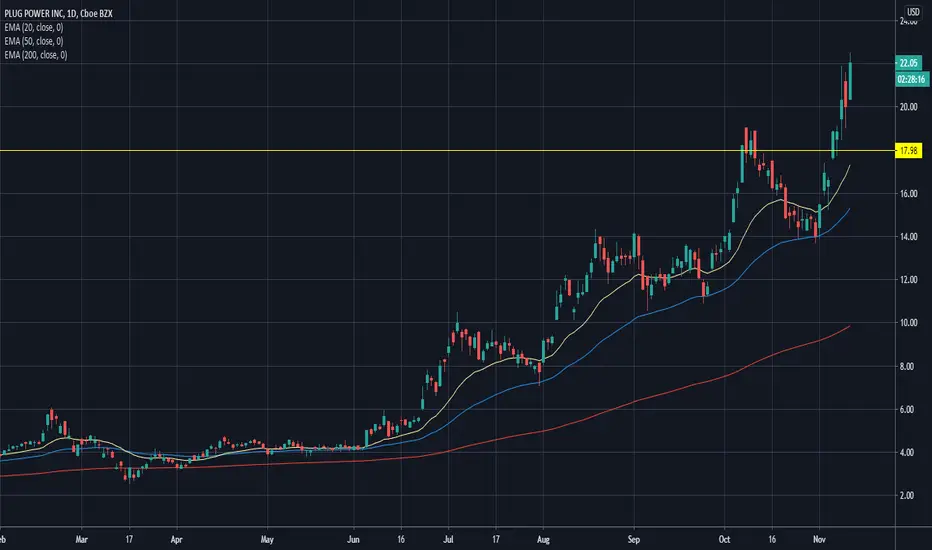
$PLUG - Take Profits or let it ride?What do you guys think? Up 30% - Bought in at $17.99. Usually at this point I would take profits, but the charge isn't signaling to sell. Thoughts?
PLUN trade ideas
$PLUG with a Bullish outlook after earnings.$PLUSG is projected with a strong Bullish outlook after a Positive under reaction following its earning release with the PEAD placing it in Drift A.
If you would like to see the Drift for another stock please message us. Also click on the Like Button if this was useful and follow us or join us.

OPTION ONLY! A PUT FOR PLUG TOMORROW!!!!! Divergence appear in RSI and STOC.
Both indicators give good signal for a down trend.
Candle Touch the resistance line
Predict: Will be up a little before going down. Short option put and take profit at 10% 15% is a goo
CONCLUSION: Option Put Will Be A GOOD Choice

a look into plug's possible accumulation cylinderit looks like it's following the exact 7 wave accumulation cylinder pattern outlined in the livermore speculative chart.

plug resumption up after retest of yearly highlooks like it could go parabolic soon. depends whether or not it breaks to the upside from the pattern. it is not yet clear whether it is an accumulation cylinder or a rising wedge but breaks of these to the upside do confirm them as accumulation cylinders and lead to parabolic moves much higher.
retests and resumptions higher are a very high probability trade. good setup here.

PLUG POWER - Technical AnalysisPLUG POWER is at its resistance level. RSI also entering in overbought zone. Its time to exit and book profits. The candle shows price rejection at the upside. Further, it has reported a loss for the current quarter. You may see selling pressure in the upcoming sessions. New buying area will be around 16.4

PLUG earnings day target $22PLUG Reported gross billings of $125.6M; reflecting growth of 106% year-over-year and 73.4% sequentially. Reflecting strong performance in the quarter; raising 2020 gross billings guidance to $325M-$330M from $310M. Hosted second annual virtual Plug Symposium showcasing strategic priorities in green hydrogen, market expansion, gigafactory and reaffirming revenue and EBITDA targets for 2024. Announced strategic partnerships with Brookfield Energy and Apex Clean Energy to source renewable electricity and build liquid green hydrogen plants. Signed an MOU with Linde to deploy pilot class-6 and class-8 vehicles on road in 2021. Recent capital raise positions the company with over $725M in cash to execute on its growth initiatives
Plug Power is building the hydrogen economy as the leading provider of comprehensive hydrogen fuel cell (HFC) turnkey solutions. The company’s innovative technology powers electric motors with hydrogen fuel cells amid an ongoing paradigm shift in the power, energy, and transportation industries to address climate change and energy security, while providing efficiency gains and meeting sustainability goals.Plug Power created the first commercially viable market for hydrogen fuel cell (HFC) technology. As a result, the company has deployed approximately 35,000 fuel cell systems for e-mobility, more than anyone else in the world, and has become the largest buyer of liquid hydrogen, having built and operated a hydrogen highway across North America. Plug Power delivers a significant value proposition to end-customers, including meaningful environmental benefits, efficiency gains, fast fueling, and lower operational costs. Plug Power’s vertically-integrated GenKey solution ties together all critical elements to power, fuel, and provide service to customers such as Amazon, BMW, The Southern Company, Carrefour, and Walmart. The company is now leveraging its know-how, modular product architecture and foundational customers to rapidly expand into other key markets including zero-emission on-road vehicles, robotics, and data centers.
Do your own due diligence, your risk is 100% your responsibility. Good luck and happy trading friends...
*3x lucky 7s of trading 101*
7pt Trading compass:
Price action
Volume average
Trend momentum
Current events
Revenue & Earnings
Debt / Cash
Book value
7 Common mistakes:
+5% portfolio trades
Bad risk management
Emotions & Opinions
FOMO
Lack of planning & discipline
Forgetting restraint
Repetitive errors
7 Important tools:
Trading View app
Accurate indicators & settings
Wide screen monitor/s
Trading log (pencil & graph paper)
Big organized desk
Reading books
Brokerage UI
Checkout my indicators:
Fibonacci VIP - volume
Fibonacci MA7 - price
www.tradingview.com

PLUG - Hydrogen Newsblog: Plug Power reports highest turnover inPlug Power is a US American manufacturer of fuel cells. The company develops and manufactures fuel cells for applications in electromobility, the operation of industrial trucks and stationary use in emergency power systems.


PLUG Earnings Historical MovesPLUG is going to report earnings on Nov 09, 2020 Before Market Open
The options market overestimated PLUG stocks earnings move 83% of the time in the last 12 quarters. As you will see bellow, this historical data (overestimated move 83%) could give us an edge on straddles or strangles with short expires (weekly).
Predicted move after earnings: ±12.6% on average. Actual earnings move after earnings: 6.3%. Because the actual move is more likely to occur, we can make the assumption that the price will fall within the overestimated move. To follow this idea click on trading view link.
Predicted ±$2.37 (12.6%) Historical Moves
BULL = $21.23
BEAR = $16.48
Actual ±$1.18 (6.3%) Historical Moves
BULL = $20.04
BEAR = $17.67
Thanks for reviewing my Idea

congrats to longs! beautiful breakout <3PLUG-parabolic breakout here, lots of upside potential ! first target would be 32, it might just keep running like NIO, PTON,OSTK to name a few.. use a trailing stop loss if you are in!! leave a like if you found this helpful <3

Plug earnings 11/09 at 7:30amPlug earnings 11/09 at 7:30am
3rd Quarter 2020
Consensus: ($0.06)
Revenue: $104.91 Million
I’m anticipating an earnings surprise with a breakout past $22+. Good luck and happy trading friends...

Plug Power | Higher High?One of my go-to stocks with an excellent looking TA. Hydrogen stocks are populair at the moment among the renewable energy market. The increased interest and adoption of fuel-cells solutions, and future hydrogen stations, makes Plug Power Inc. an interesting stock to put on your radar. Moreover, it will be even more interesting when it can benefit from the Biden-Harris ‘ticket’ and their $2 trillion climate plan.
Additional Info:
• November 9, PLUG will announce Q3 2020 results (the company had some difficulties regarding achieving profitable growth, but are now in the good direction).
• Plug Power remains on track with the ‘Gigafactory’ and its $1.2B revenue plan.
• Plug Power’s largest customers like Amazon, Walmart and Kroger are benefiting from strong demand for its products.
• Plug Power vertically integrated two hydrogen companies, which grown Plug Power’s opportunities.

PLUG Breakout Long IdeaDay Trade. May not happen tomorrow, but will be on watch for a break over 19 and a push to 20-21. I'm placing my stop at 18.50 Hoping this happens before earnings.

$PLUG Plug Power $22.00 Target
potential entry on next breakout above $19.30
Target level $22.00
Take care as earnings approach, got to decide do you want to hold it.

Position initiated - PT $24Found support on the daily trend line. $13.70 was defended strongly by the bulls.

PLUG Looks Technically Good but a Few Concerns AheadIn this chart we are using the Moving Average Delta (MAD). The MAD calculates the difference between the price and the moving average. Using these two data points helps us see price movements that are normally difficult to see.
The MAD may signal a trend change when the line begins to turn toward 0, the steep of the curve represents velocity of the movement.
Bull Cases
1) Our indicator is showing a trend change with velocity
2) We are in a zone the MAD has historically considered oversold and has reversed from
3) We have made a higher low while managing to appear steeply oversold on the MAD
4) Possible positive response from president
Bear Cases:
1) We established a megaphone pattern which concerns me.
2) Earnings are released Nov 5. and if they disappoint that could severely impact the integrity of our 5 month bull trend.
3) We don't have a lot of support beneath us.
4) Possible negative response from president
I'll let you make the decision which case looks stronger to you.
NASDAQ:PLUG
Indicator: Moving Average Delta Indicator by KIVANC fr3762


MY BREAKDOWN OF $PLUG Looking for a continuation into earnings. I am expecting PLUG to beat earnings and that be a catalyst for new ATH


$PLUG Power Bullish Trendline Breakout
Very Bullish trend break today in PLUG, which seen it break above the
200ma on monthly chart.
targets to consider.
$16.10 - 20MA
$17.00 - Fibonacci Golden pocket
$19.00 - All Time High
Indicators all in bullish reversals.

PLUG Setting UpPLUG is showing some relative strength today and seems to be putting in a bottom at previous resistance. Good look and easy to manage risk - but just watching for now
