Ascending megaphone shape for RCLSince the trendline slopes upward, do not short, it could be very risky.
If it reaches bottom trendline again and price bounces off the bottom trendline, it could be a good entry point (at around $100) for a short term target of the resistance line (around $132).
RC8 trade ideas

RCL Royal Caribbean Cruises Options Ahead of EarningsAnalyzing the options chain and the chart patterns of RCL Royal Caribbean Cruises prior to the earnings report this week,
I would consider purchasing the 130usd strike price Calls with
an expiration date of 2024-3-15,
for a premium of approximately $6.25.
If these options prove to be profitable prior to the earnings release, I would sell at least half of them.

Messi and Team Trade Cryptocurrency for Cruise SponsorshipInter Miami's Surprising Shift:
Major League Soccer's Inter Miami, led by the iconic Lionel Messi, has opted to replace cryptocurrency investment firm XBTO Group with global cruise operator Royal Caribbean International ( NYSE:RCL ) as its main sponsor. The strategic decision, announced at a grand unveiling event, marks a departure from the crypto industry, signaling a new era for the football club as it embraces a multiyear partnership with one of the world's largest cruise line operators.
The unexpected sponsorship switch comes on the heels of Inter Miami's groundbreaking multi-year deal with XBTO Group in September 2021, touted as one of the largest in American Football League history. At the time, the partnership was celebrated as a significant milestone in mainstream crypto acceptance, positioning Miami as a potential crypto hub.
However, the latest move raises questions about the club's commitment to the cryptocurrency space. The shift from crypto to the cruise industry with Royal Caribbean International ( NYSE:RCL ) hints at a broader trend in Miami, where sports teams seem to be distancing themselves from the crypto sector. This move follows the NBA's Miami Heat, whose home arena changed from the FTX Arena to the Kaseya Center after the collapse of crypto exchange FTX in November 2022.
The timing of Inter Miami's decision is noteworthy as it aligns with the imminent start of the MLS campaign, set to kick off next month. The club seems keen on harnessing the global appeal of Lionel Messi, an eight-time Ballon d'Or winner, as it seeks to capitalize on the soccer superstar's popularity in this strategic partnership with Royal Caribbean International ( NYSE:RCL ).
Royal Caribbean ( NYSE:RCL ), a Florida-based cruise giant, expressed enthusiasm about the collaboration. Jason Liberty, President and CEO of Royal Caribbean Group ( NYSE:RCL ), conveyed excitement about combining forces and outlined expectations for the partnership's impact on the industries, global fans, and local communities in South Florida.
Messi's involvement with Royal Caribbean ( NYSE:RCL ) goes beyond the football pitch, as he recently played a role in launching the colossal "Icon of the Seas" ship. The partnership extends beyond jersey branding, with Messi actively contributing to Royal Caribbean's ventures, including a collaboration with Hard Rock International on a distinctive "Milanese style" chicken sandwich.
The decision to pivot towards a cruise operator aligns with the broader recovery of the cruise industry from the impact of the Covid-19 pandemic. U.S. cruise operators and travel agents anticipate a banner year for cruise vacations in 2024, signaling optimism and resilience after facing challenges during the global health crisis.

$RCL, so long and thanks for all the fish!I've been a holder of NYSE:RCL since 2021 and I'm happy with the stock. Still, today I sold my shares. Here's why:
First on the technicals: The stock ran 50% since its late October bottom without even a two-day correction. So, it's due for some of that. Also, @LonesomeTheBlue's terrific Trend Lines Pro tool identifies 2 competing rising trading channels on a 2-hour bar chart. It appears as if price were getting squeezed into a bearish wedge pattern, as traders attempt to keep the stock inside both of these channels. When wedges break they can give rise to explosive price moves, and given the overbought nature of the stock, I think it's more likely that the wedge will resolve to the downside.
Secondly, a similar, but mirrored effect is becoming visible on the Money Flow Index (MFI). Money Flow Index is basically a volume-adjusted RSI. Divergences between price and MFI have the same interpretation as those between price and RSI. So, the picture is not good: While price has reached a new YTD high, and is within striking distance of an ATH, MFI is breaking down to a new 6-week low.
On the fundamentals, While the price of the stock is still 10% below the ATH made at the end of 2019, market cap already exceeds that of 2019-12-31 by 10%, and enterprise value (EV) is ahead of that previous record by more than 25%. This is because Royal Caribbean was forced to issue a lot of shares and a lot of debt to bridge the cash flow drought during the COVID shutdown. The problem with this is that such EV demands an equally high EBITDA in order to arrive at a reasonable multiple.
The present multiple of EV to NTM EBITDA is 10.1x. That's roughly in line with the long-term average. However, embedded in this calculation is an expected NTM EBITDA of $5.1B, which is 40% more than TTM. Is that achievable? Well, tt would be a new record, but sure: As long as fuel prices stay low, the cruise industry doesn't get into another fight with Florida's hot-tempered governor, and there's no recession, no pandemic, and no hurricanes getting in the way of cruise ships.
I guess all I'm saying is that I see better risk/reward elsewhere. So, good-bye and good luck to all shareholders aboard $RCL.

Royal Caribbean Cruises $RCL Trade IdeaEntered the NYSE:RCL trade yesterday as the price closed above the resistance zone. We also had a re-test the same day.
Today the price is up and my trade is profitable. In the short term, the oscillators are overbought which suggests that we could have a pullback soon as the price enters the choppy demand and supply zones from the past.
My medium term price target for NYSE:RCL is about the $130 price level should the trend continue.
The short and medium term MAs are sloping up indicating that the short/medium trend is in a bullish momentum.
We broke out of the resistance on dailies might be a good entry or can wait for a retest of the old diagonal resistance now support around the $100 price point. Not sure if the price will get there however.
If this was helpful, follow me for more trade ideas.
Thank you,
BK

Why Royal Caribbean (NYSE: RCL) May be Well Position for a SurgeRoyal Caribbean (RCL) could be a solid addition to your portfolio given a notable revision in the company's earnings estimates. While the stock has been gaining lately, the trend might continue since its earnings outlook is still improving.
Current-Quarter Estimate Revisions
The company is expected to earn $1.10 per share for the current quarter, which represents a year-over-year change of +198.21%.
Current-Year Estimate Revisions
For the full year, the earnings estimate of $6.52 per share represents a change of +186.93% from the year-ago number.
The revisions trend for the current year also appears quite promising for Royal Caribbean, with seven estimates moving higher over the past month compared to no negative revisions.
Investors have been betting on Royal Caribbean because of its solid estimate revisions, as evident from the stock's 7% gain over the past four weeks. As its earnings growth prospects might push the stock higher, you may consider adding it to your portfolio right away.
Price Momentum
RCL is trading near the top of its 52-week range and above its 200-day simple moving average.
What does this mean?
Investors have been pushing the share price higher, and the stock still appears to have upward momentum. This is a positive sign for the stock's future value.

ABC/DSHORT interest is over 8%.
The target is D.
Possible stop below C.
This pattern forms over and over in the market and is a measured move down. Price hits C and goes back up. When D is reached, the target, this pattern often reverses.
The Auto-fib indicator on TV can help one spot this pattern. C will be at the 0 level of the fib table using this indicator. If price goes too much below C, the pattern is not valid.
No recommendation

$RCL Fibonacci Support .618NYSE:RCL Fibonacci Support .618 The Royal Caribbean Cruises Ltd. ( NYSE:RCL ) stock appears to be interacting with a significant level of Fibonacci support at the .618 retracement. This level is often considered a crucial juncture in technical analysis, serving as a potential turning point where the asset could find support and rebound. Originating from the Fibonacci sequence, the .618 level is commonly referred to as the "Golden Ratio," and it's widely employed by traders to predict potential areas of support or resistance.

🚢 Royal Caribbean Cruises: Ready to Set Sail? 🌊Hey traders! 🖐️
I've been keeping a keen eye on Royal Caribbean Cruises (RCL), and I believe there's a good chance it's preparing to embark on a bullish journey! Here are my observations:
1️⃣ Consolidation Period: Since July, NYSE:RCL has been in a consolidation phase. These periods often precede significant price movements as the market 'decides' on the stock's next direction.
2️⃣ Current Price & Bull Flag: At a current price of $97.29, there's a clear bull flag pattern emerging on the chart. 🚩 This pattern is generally seen as a bullish continuation, suggesting we might see a break to the upside soon!
3️⃣ Weekly Higher Low?: There seems to be a formation of a higher low on the weekly timeframe. This could be indicative of a strengthening bullish trend.
4️⃣ Volume Divergence: I've also noticed some divergence in volume. This can often signal a potential reversal or strengthening of the current trend, so it's definitely something to keep tabs on! 🔊
Final Thoughts:
While the sea of the stock market is unpredictable, NYSE:RCL is showing some promising signs for bullish traders. Always set your stop-losses, have a trading plan, and never invest money you can't afford to lose.
Wishing everyone smooth sailing and profitable trades! 🚢💰📈

RCL(Royal caribbean Cruises Ltd)Hi traders ... i specify for you my short area on RLC . if it close and confirm above 136usd daily my position will be fail and stop out as i highlighted that on screen.
be aware that is daily and swing trade not long term .
share this with your friend .
Good luck

$RCL Double Top & Gann PriceNYSE:RCL Double Top & Gann Price $112 Royal Caribbean Cruises (RCL) almost tested a double top today at This is a technical pattern that occurs when the price of a stock forms two peaks that are the same or very close in price. The second peak is usually lower than the first peak, and it indicates that the momentum of the uptrend is starting to fade.

RCL - Rising Trend Channel [MID TERM]🔹RCL is in a rising trend channel in the medium long term.
🔹Short term momentum is strongly positive, with RSI above 70.
🔹Overall assessed as technically positive for the medium long term.
Chart Pattern;
🔹DT - Double Top | BEARISH | 🔴
🔹DB - Double Bottom | BULLISH | 🟢
🔹HNS - Head & Shoulder | BEARISH | 🔴
🔹REC - Rectangle | 🔵
🔹iHNS - inverse head & Shoulder | BULLISH | 🟢
Verify it first and believe later.
WavePoint ❤️

RCL Grinding Up On Strong Resistance
RCL experiencing declining volume, and being highly leveraged in a tumultuous macro environment leads me to believe this recent rally in price will struggle to overcome the strong resistance zone of 93-99 a share.
Retreat back to 65 support seems probable in the intermediate term.
As always, this is not financial advice. Good luck!

$RCL $70 lookin like a good entryWatching RCL and CCL here as covid continues to pass and people get back to spending money before it's all gone.

RCL Royal Cruises LongRCL had a triple top this past winder then downtrend to the Fib 0.5 level.
On the chart, the tripe top is also resistance with sell orders blocks by the indicator.
The fib 0.5 level $ 61.27 is the support. A stop loss could be placed immediately
below that. The zero-lag MACD shows nearish divergence while the price rose into
the triple. That divergence has not yet recurred. I see this as a swing long while
RCL seeks to recover its customer base and rebuild its revenue stream.

RCL LongRCL is on of the companies I have on my Strong list. With the COVID19 easing for travel and as people shift from spending on products to services. The recent earnings call have also seen management talking of them experiencing a record wave session. Fuel prices has also gone down.
I'm not so sure how they would hold up to inflation fears, so I think this is a quick exit stock (Trade duration in the weeks instead of months)
Whats The Plan/Trade/Thought
We have to adopt a Range market stance. When markets are going up with optimism , we will peg categories with strong fundamentals and a growth story as that will be where money will flow into.
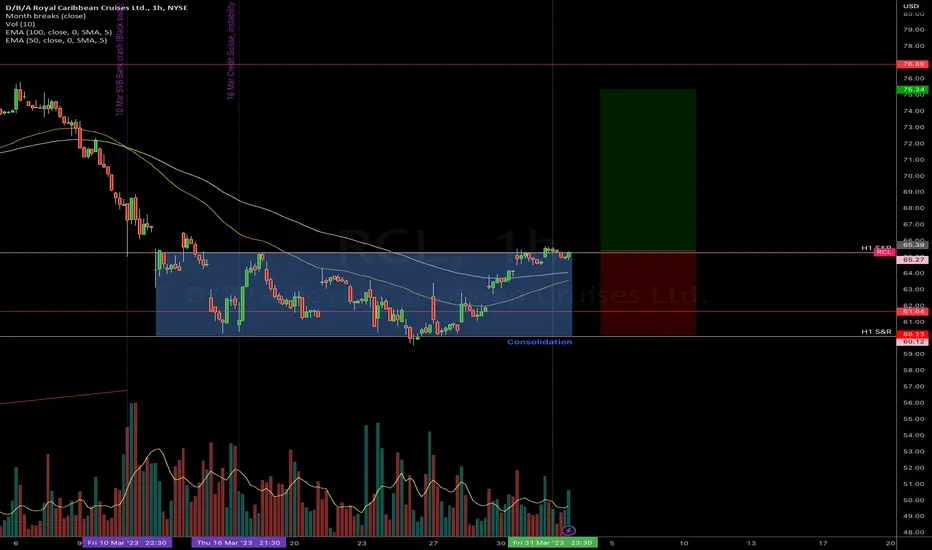
We plan the trade on the Daily charts and exit on the H1 chart and right now we are exiting a H1 consolidation which seem to be a potential strategy for 2023
Can You Trade The Opposite Side (Y/N)
No
$RCL with a bullish outlook following its earnings #StocksThe PEAD projected a bullish outlook for $RCL after a positive under reaction following its earnings release placing the stock in drift A with an expected accuracy of 70%.

RCL to $64RCL is in a strong weekly trend resistance here. Wait for it to hit $76-$77, and I believe it will head down afterwards.
Not financial advice, good luck to all

Possible midterm triangle in RCLTouristic sector still is oversold after pandemic, but perspective to recover looks pretty possible. If the triangle turns to be true - buy on the end of E wave will be a great opportunity for traders.
Will look out around 51-53 to decide whether it is a triangle or just a pull back before getting much higher

RCL Bear flag shown here.While RCL is a strong stock and could rally up 10% from here (I prefer longs), it hit upper resistance and is in the middle of a well defined bear flag that could easily breakdown to $35.

Royal Caribbean Cruises (Long)Royal Caribbean Cruises
Long
Entry at 64.75
Take Profit 1 at 71.64 (10.64% profit from entry)
Take Profit 2 at 77.29 (19.37% profit from entry)
Stop loss at 60.50

LONG ROYAL CARIBBEAN CRUISES RCL/USD HIGH PRECISION TRADINGRCL/USD 1 day Shopping ✅
Entry Point : USD 48.0
Target : USD 71.0
Stall Brake : USD 46.0
Speculation is extremely risky and must be executed with money that we are willing to lose or touch the stop loss.
Leave a comment that is helpful or encouraging. Together we can dominate the markets.
Trading is the only trade in which the only one responsible for our actions is oneself, our worst enemy is oneself, here there is no one to blame, this is not a collective work, the only one who presses the sell button buy and knows how much to invest and where to stop losses is you, and only you, so always remember that.
Important note: THE LEVEL OF LEVERAGE, the alert for taking early profits, the adjustment of the stop loss and the closing of forced operations are not made by this means.
And also always remember to have control over your losses, focus on this and you will lose.
Comment: WARNING!!!!
I AM NOT A FUTURIST, I DO NOT MAKE PREDICTIONS.
I AM A 100% MARKET OPERATOR, I WORK BASED ON MY EXPERIENCE, CONSISTENCY AND MY TRADING PLANNING.

RCL Call Options..In bound premiums Based on trend analysis and daily candle close a see a some short term buyer taking control of current trend. Be weary.
