RCL out of the wedge and moving up nicely! Swings up nicely. June calls over 100% and holding SL set to secure green trade
RC8 trade ideas

RCL BUY OPPORTUNITYRCL recovering from Covid crash. Optimism in the Cruising industry will push price back to heavy liquidity area at the 136-140 Price point. Expect a new dip once liquidity is captured...

RCLNot what I usually trade, but this could be a good time to leg in to a position. Also, option Ivol is high so selling calls can work.

Royal BloodGood day starts with a good trade, folks🔥
There is one more Flag formation on RLC.
The price was in a slight bullish trend before entering into consolidation.
Multiple times it bounced from support and resistance zones.
Bullish impulse is expected after breaking resistance zone .
So follow the chart and look for the breakout carefully.
_____________________________________________________
If you enjoy my FREE Analysis , support the idea with a big LIKE👍 and don't forget to SUBSCRIBE my channel, you won't miss anything!
Feel free to leave comments✉️
And always remember: "we don't predict, we react".

RCL looking like another leg up coming Volume shelf, reopening play, cruises restarting, thesis and chart lining up here.


RCL: Breakout Confirmed, 30.00% Potential Profit!Description: RCL is trending higher and in an uptrend meaning that highs are getting higher and lows are getting higher. The uptrend line on the chart and the Trending Band Indicator (which measures trend) supports the Long Position.
Stats:
1. Ideal buy range: $82.6 - $87.6
2. Take profit: $110.02
3. Stop Loss: $79.37
4. Risk To Reward: 1 / 5
5. Accuracy Rating: 91%

$RCL Watching for Break OutNYSE:RCL has been in a BULLISH FLAG since late February.
Will we see a retracement or momentum up from this last tall GREEN candle on the Daily timeframe?
RSI is above 50
Not financial advice. Please do your own research.

RCL falling wedge FALLING WEDGE = BEAR FLAG, William R/ RSI/ MACD coming down to oversold territory. GREEN lines are Monthly support level and could bounce off before heading up to 90s

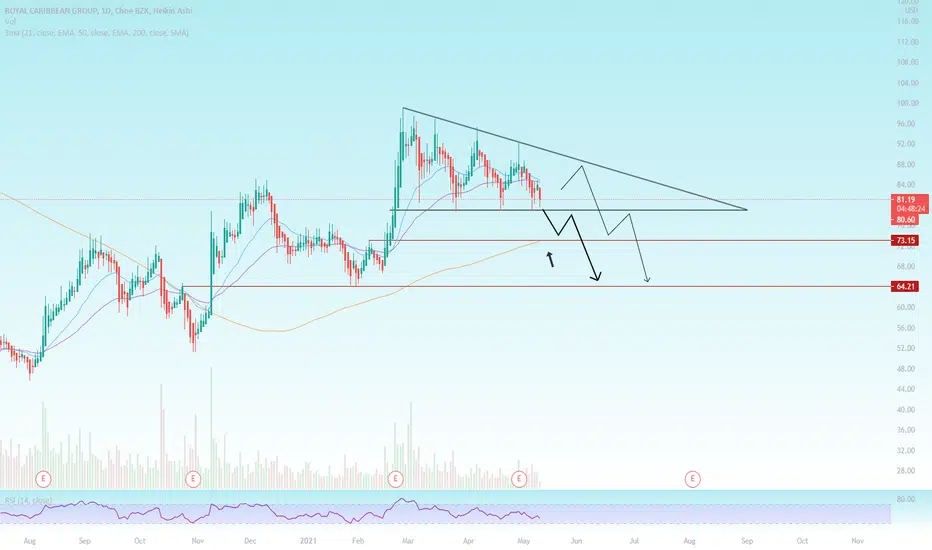
RCL Short to 65...Although in the long term I am bullish on cruise lines, especially with covid restrictions being lifted, as of now this market is not kind to much of the recovery stocks
This is textbook put play, we have a descending triangle formed on the daily and its just barely being held by this ~79 support level
I will be playing 6/18 75p on a confirmed break of 78.50
PT1: (200sma) 73.15
PT2: 64.21
Happy trading!
RCL 1D BULL FLAGBull Flags are a Range that is a repeatable trading chart pattern.
Bull Flags are a descending range chart patterns that will have a directional bias (Long) depending on the previous incoming trend.
Each chart pattern will have defining trendlines of the support/resistance levels creating the pattern.
What ever time frame you are trading this chart pattern, wait for a candle close outside of the trendline in the direction of the breakout candle. (Our time frame preference is the Daily chart).
Add volume indicator - Volume is the amount of $ that went into a particular candle or in Forex the # of trades that took place.
Add ATR indicator - Volatility is the amount of price movement that occurred. Use the ATR to measure the price movement.
When you see descending Volume bars and descending ATR line (which indicates volatility) this shows
a dis-interest in traders to invest in this pair creating consolidation which creates the chart pattern.
Trade Management after there is a breakout candle close.
1 - Position size (compare volume bar to volume ma line).
a - Breakout candle must be 100% of volume average for a full position size.
b - If 75% of volume average then ½ position size. (To find 75% of Volume
look at the charts volume settings – divide smaller # into larger # = 75%+)
If not 75% then stand aside from the trade.
2 – If candle breaks out of a trendline, 15m before the close of the day prepare your buy/sell order.
Enter two trades. 1st trade will have a SL & TP. It will close automatically when the 1st TP is hit. 2nd
trade only has a SL and will be allowed to run. When 1st TP is hit move the SL to breakeven. Look
at ATR and prepare SL at 1.5 of ATR. Prepare 1st trade TP at 1 of ATR.
3 - SL for both trades will be 1.5 x ATR.
4 - 1st trade TP will be 1 x ATR.
5 - No TP on 2nd trade – letting profit run and adjusting SL to follow price.
6 - When 1st TP hit – move 2nd trade SL to breakeven.
7 - Adjust the 2nd trade SL to follow price.
*8 – After Breakout candle – if price closes back into chart pattern close trade don't wait for SL to be hit.
*9 - When breakout candle is more than 1 ATR from breakout candle open.
a - Enter 1st trade at candle close with ½ position size.
b - Enter 2nd trade with a pending limit order that is 1 ATR of breakout candle open.
c – Price should pullback to that pending limit order for 2nd trade.
d – If Price returns back into chart pattern close trade before SL is hit.

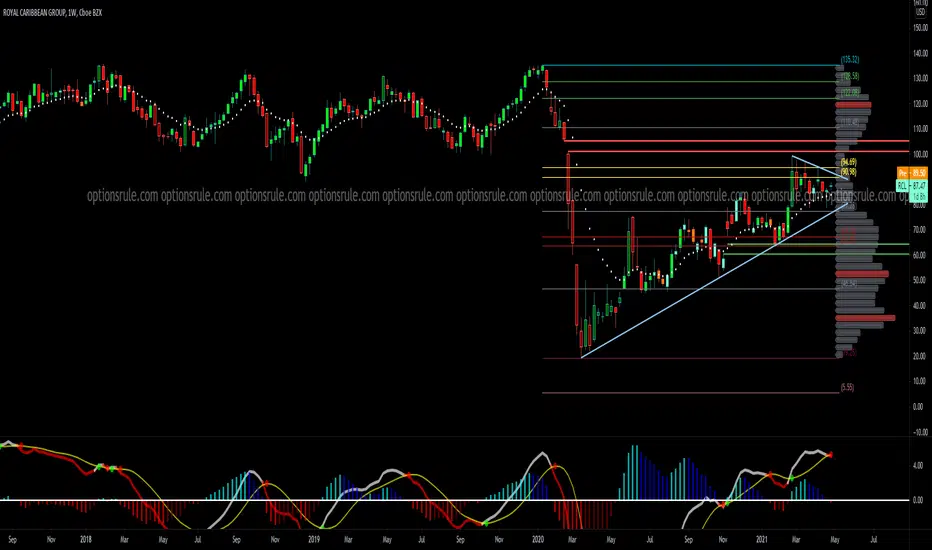
RCL - Winding Up Once Again? Royal Caribbean had crumbled in value, with it going from a previous high of $136 to $20 in a matter of two months. I have good faith that this summer holidays will be back on for the majority of the western world, but for how long? I'm not too sure. We have seen a strong comeback and I see potential for further upside with a attractive 1:3 RRR .
As you can see on the chart above a particular patterns seems to be appearing. Which is a tight bear flag / falling wedge , so strong momentum to the upside when it breaks. With a bull run averaging $32 on average... until a pullback happens, which is a sign of a healthy bullish trend .
One stock CCL has been almost identical to RCL's charting technicals. So, we can see it's not just a company recovering, it's actually a whole sector recovering.
CCL is based is in the UK which is doing very well in returning back to normal and having holidays in the coming months. Drop a like if you would like to see my analysis!
I have set a buy stop around the 0.5 - 0.618 fib level which has been respectfully met on all of the pull backs in the past year. Targets are set to $110, but profit will be taken along the way. Later entries are also in the play around the $90-91 mark. I would expect a strong break to the upside before entering... Be careful don't over leverage yourself.
Let me know what you think! Any constructive criticism or compliments would be greatly appreciated


Buy $RCL - NRPicks 09 AbrRoyal Caribbean Group operates as a cruise company throughout the world. The company operates cruises under the Royal Caribbean International, Celebrity Cruises, Azamara and Silversea Cruises brands, which comprise a range of itineraries requiring approximately 1,000 destinations.
Bullish trend since March 2020, with key levels close to $ 84 and with the price above the MA50 but below the MA200.
Florida is a state that lost $ 3.2B as a result of cruise closures, however the outlook for cruise ships is positive as of June.
- Market Cap. $ 22.8B
- Revenue 2020 $ 2.2B
- Cash $ 3.6B
- P / B 2.30
- LT DEBT / EQUITY 2.05x

breakout backtestplaying crusielines long here on the gap and go, RCL favorite for options, CCL best for Underlying

Classic Bull PennantWith the reopening of cruises it seems likely RCL will continue to move in a longer bull trend

RCL BreakoutRCL is looking strong as travel and reopening trades are back in play here. We're looking for a break out of this resistance, which we already saw last week. A green candle close above this level would indicate a move back up to the highs - PT 95.5, resistance at 92 a d gap fill from 93-94, ultimately targetting low 100s before May. SL set below 87.8, a key support level. 3.5:1 Reward to Risk Ratio play on a 1-2 month swing! If you're signed up for premium, we called this one out Friday!

ROYAL CARRIBEAN CRUISE LINES - RCL "WATCH OUT BELOW"STEALTH SHORTS UNDER COVER.
WATCH CHAIKIN AND A/D LINE FOR MORE INFORMATION.
WATCH OUT BELOW.
$70 AND SOUTH COMING.


RCL: Bullish PennantBullish Pennant
Pros:
Descending volume during formation
Golden cross in blue
PPS above 50MA and 200MA
RS above 0, and ascending
ATR Ascending
R/R ratio above 7
250RSI above 50
200MA ascending
Target:
PT = 129.13$
1000 Followers! Thank you all!
Thank you to those who donate Coins!
Stay Humble, have fun, make money!

2021 Actual Trade: RCL +25% Profitswe bought RCL that was about +10% on 02/16. This is the breakout day.
From the featured chart, we can easily identify its bullish falling wedge pattern. Its breakout with higher volume. Most importantly, the entire cruise industry was up altogether (RCL, CCL, NCLH) together with airliners and hotels.
The fundamental reason is its bullish outlook for decline COVID-19 cases due to vaccines. It may be hard to know whether this is a true or false estimation but traders were in for that reason.
The overall market becomes volatile these days so we decided to take quick one week profits of +25% from RCL.

Royal Caribbean earnings Monday 2/22 at 8amRoyal Caribbean earnings are on Monday 2/22 at 8am. Royal Caribbean Cruises (RCL) reported a 3rd Quarter September 2020 loss of $5.62 per share on revenue of $33.7 million. The consensus estimate was a loss of $4.92 per share on revenue of $112.5 million. Revenue fell 98.9% compared to the same quarter a year ago. MY range is $65 low, $70.5 mid, $76 high.
4th Quarter December 2020
Consensus =
EPS: (-$5.04)
Revenue: $52.14 M
Do your own due diligence, your risk is 100% your responsibility. You win some or you learn some. Consider being charitable with some of your profit to help humankind. Small incremental steps work : If you double a penny a day for a month it = $5,368,709. Good luck and happy trading friends...
*3x lucky 7s of trading*
7pt Trading compass:
Price action, entry/exit
Volume average/direction
Trend, patterns, momentum
Newsworthy current events
Revenue
Earnings
Balance sheet
7 Common mistakes:
+5% portfolio trades, risk management
Beware of analysts motives
Emotions & Opinions
FOMO : bad timing
Lack of planning & discipline
Forgetting restraint
Obdurate repetitive errors, no adaptation
7 Important tools:
Trading View app!, Brokerage UI
Accurate indicators & settings
Wide screen monitor/s
Trading log (pencil & graph paper)
Big organized desk
Reading books, playing chess
Sorted watch-list
Checkout my indicators:
Fibonacci VIP - volume
Fibonacci MA7 - price
pi RSI - trend momentum
TTC - trend channel
AlertiT - notification
www.tradingview.com
