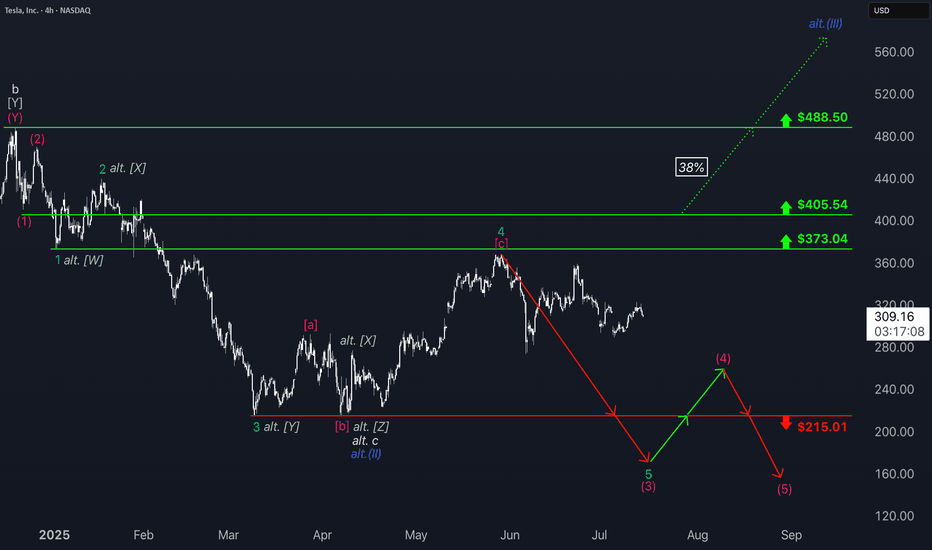
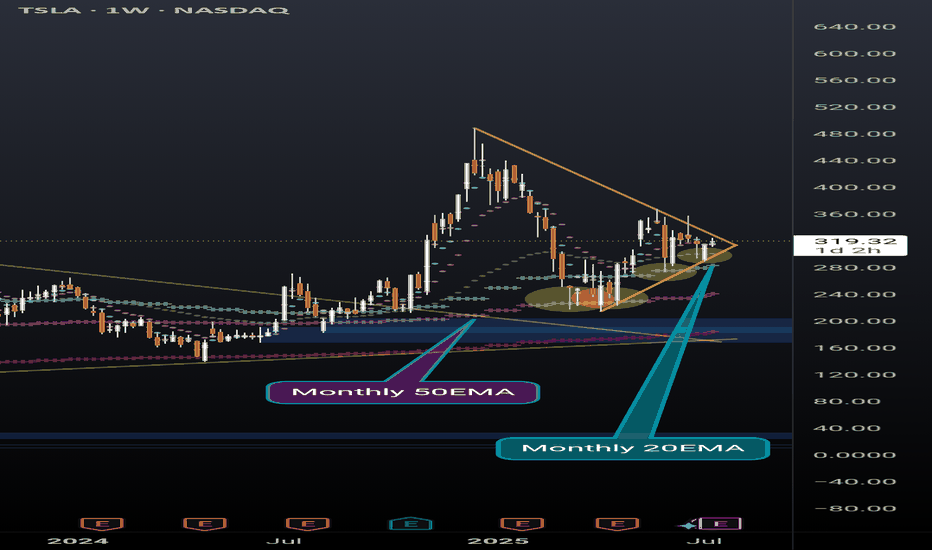
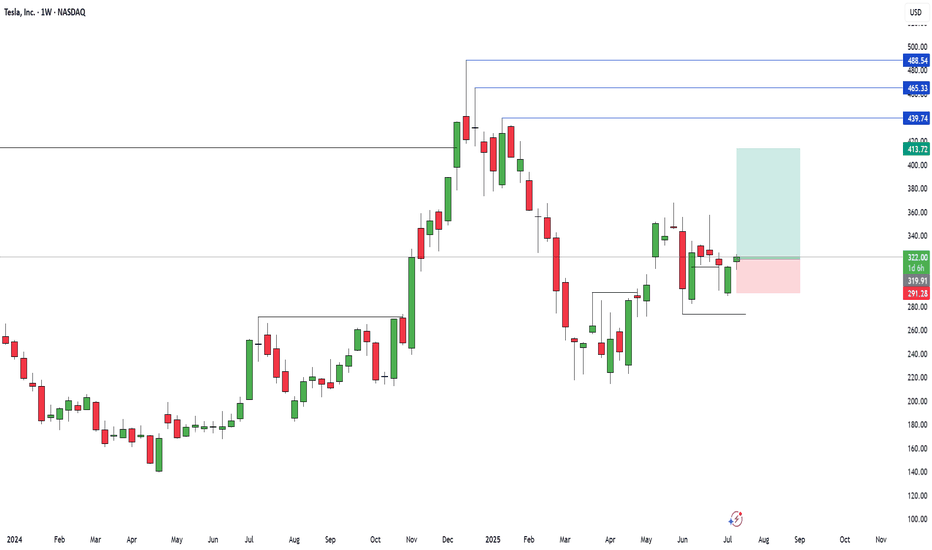
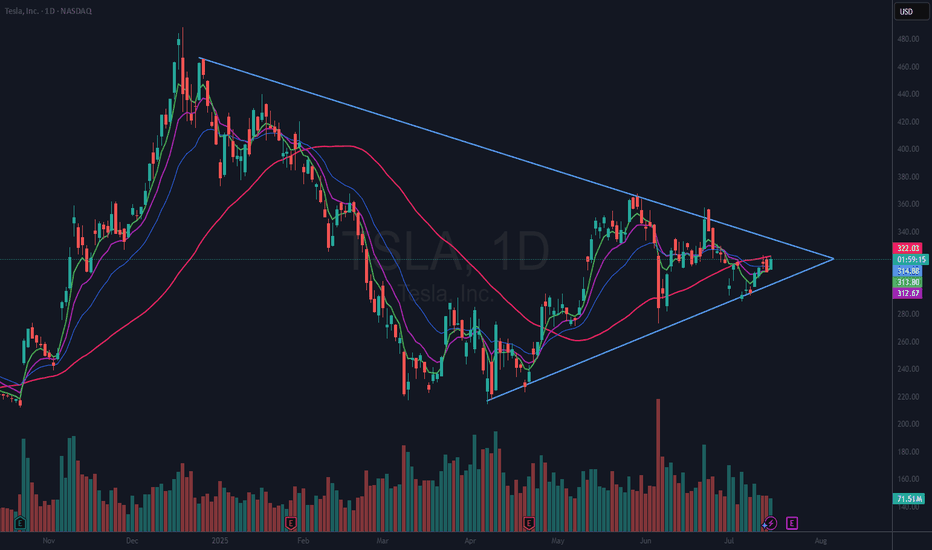
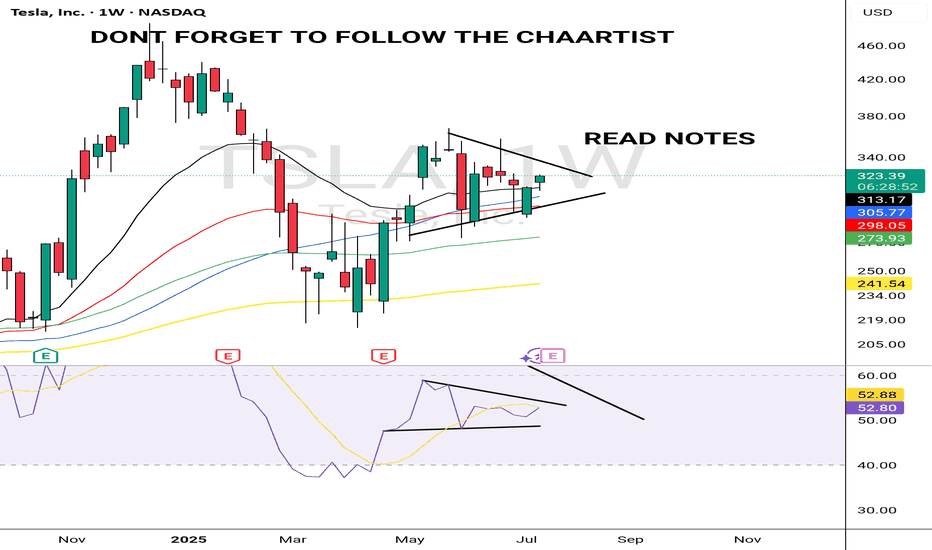
the downtrend is broken!boost and follow for more! ❤️🔥 Tesla is finally breaking its downtrend it entered at the start of the year, it also had a bullish resistance = support bounce after the initial breakout! I think we may rally to my 300-336-376 short term term targets from here 🎯Longby Aura_TradesUpdated 4343103
UPDATE: Level hold perfectly; you sold fear. New ATH is coming!Tesla is ready for a new ATH and potentially 20X even more. It's not only an EV cars company, as many wrongly see it. This is an update of my previous analysis, which received so much hate, but it doesn't change my view. I have added a massive amount at 22O, and it will be an amazing ride until the end of this decade. Here are the facts. They make more revenue in multiple sources than many people see I'm adding a graphical presentation from CernBasher (Tesla specialist) of how the Robotaxi and Optimus can be big. Yes, they might not reach the targets, but even if it's just half. It will be huge. Their Robotaxi business will rapidly outweigh the EV cars business in the near future. Now he has Trump and he will allow him all necessary licenses. and Tesla Optimus will even outperform the Robotaxi. Seems unreal, but the complexity of making a bot is easier than a car. They plan to run robot production faster than anything that has been ramped. The complexity of creating a bot is much less than a car. Also, once they start producing the bots, their factory will become more efficient. One bot can replace three people. The liquidity cycle is coming 🤔I think Optimus and Robotaxi will rapidly exceed their EV car revenue. Elon Musk is predicting over 1000% growth in 5 years. Which would be way above $2900 without stock splits. David Perk Longby David_Perk3232119
TESLA is up 47X vs the SPX. Can it do another 6.9X?An extraordinary unicorn enterprise, or a collection of companies and intellectual properties, led by the most prominent CEO in the history of public companies. TESLA and ELON are impossible to overlook, and this chart has kept many observers on the sidelines for over 14 years. In the initial 6 to 9 years, Wall Street analysts and commentators failed to grasp the bigger picture, focusing excessively on the balance sheet and evaluating the company merely as an automaker. They completely missed the groundbreaking technologies being developed and advanced. Today, we stand on the brink of fully autonomous vehicles becoming commonplace, artificial intelligence integrating into our everyday lives, and affordable space exploration becoming a reality, not to mention the myriad of other innovative technologies emerging from this remarkable company. Individuals often enjoy predicting market peaks and labeling stocks as overvalued. However, this chart comparing Tesla to the S&P 500 indicates that the stock may be gearing up for another surge to new heights. Picture 10 million robotaxis cruising through our streets. Envision a fleet of vehicles that not only generates income but also undergoes upgrade cycles, in contrast to traditional cars that face maintenance cycles, and are bogged down by Human operator's. This development is poised to significantly transform the self-hailing ride-sharing market and the food delivery sector, potentially eliminating the role of human drivers. In fact, Uber could very well become Tesla's largest client!Longby BallaJi282851
Tesla - There Is Hope For Bulls!Tesla ( NASDAQ:TSLA ) is just crashing recently: Click chart above to see the detailed analysis👆🏻 After Tesla perfectly retested the previous all time high just a couple of weeks ago, we now witnessed a quite expected rejection of about -50%. However market structure remains still bullish and if we see some bullish confirmation, a substantial move higher will follow soon. Levels to watch: $260, $400 Keep your long term vision! Philip (BasicTrading)Long03:22by basictradingtvUpdated 5252111
$100, $1,000, $100,000 — When Numbers Become Turning PointsHey! Have you ever wondered why 100 feels... special? 🤔 Round numbers are like hidden magnets in the market. 100. 500. 1,000. They feel complete. They stand out. They grab our attention and make us pause. In financial markets, these are the levels where price often slows down, stalls, or makes a surprising turn. I’ll admit, once I confused the market with real life. I hoped a round number would cause a reversal in any situation. Like when I stepped on the scale and saw a clean 100 staring back at me, a level often known as strong resistance. I waited for a bounce, a sudden reversal... but nothing. The market reacts. My body? Not so much. 🤷♂️ The market reacts. But why? What makes these numbers so powerful? The answer lies in our minds, in market dynamics, and in our human tendency to crave simplicity. ------------------------------------- Psychology: Why our brain loves round numbers The human mind is designed to create structure. Round numbers are like lighthouses in the chaos — simple, memorable, and logical. If someone asks how much your sofa cost, you’re more likely to say "a grand" than "963.40 dollars." That’s normal. It’s your brain seeking clarity with minimal effort. In financial markets, round numbers become key reference points. Traders, investors, even algorithms gravitate toward them. If enough people believe 100 is important, they start acting around that level — buying, selling, waiting. That belief becomes reality, whether it's rational or not. We anchor decisions to familiar numbers because they feel safe, clean, and "right." Walmart (WMT) and the $100 mark Round numbers also carry emotional weight. 100 feels like a milestone, a finish line. It’s not just a number, it’s both an ending and a beginning. ------------------------------------- Round numbers in the market: Resistance and support Round number as a resistance Imagine a stock climbing steadily: 85, 92, 98... and then it hits 100. Suddenly, it stalls. Why? Investors who bought earlier see 100 as a "perfect" profit point. "A hundred bucks. Time to sell." Many pre-set sell orders are already waiting. Most people don’t place orders at $96.73. They aim for 100. A strong and symbolic. At the same time, speculators and short sellers may step in, viewing 100 as too high. This creates pressure, slowing the rally or pushing the price back down. If a stock begins its journey at, say, $35, the next key round levels for me are: 50, 100, 150, 200, 500, 1,000, 2,000, 5,000, 10,000… Slide from my training materials These levels have proven themselves again and again — often causing sideways movement or corrections. When I recently reviewed the entire S&P 500 list, for example $200 showed up consistently as a resistance point. It’s pure psychology. Round numbers feel "high" — and it's often the perfect moment to lock in profits and reallocate capital. Bitcoin at $100,000. Netflix at $1,000. Tesla at $500. Walmart at $100. Palantir at $100. These are just a few recent examples. Round number support: A lifeline for buyers The same logic works in reverse. When price falls through 130, 115, 105... and lands near 100, buyers often step in. "100 looks like a good entry," they say. It feels like solid ground after a drop. We love comeback stories. Phoenix moments. Underdogs rising. Buy orders stack up and the price drop pauses. Some examples: Meta Platforms (META) Amazon.com (AMZN) — $100 acted as resistance for years, then became support after a breakout Tesla (TSLA) ------------------------------------- Why round numbers work for both buyers and sellers Buyers and the illusion of a bargain If a stock falls from 137 to 110 and approaches 100, buyers feel like it’s hit bottom. Psychologically, 100 feels cheap and safe. Even if the company’s fundamentals haven’t changed, 100 just "feels right." It’s like seeing a price tag of $9.99 — our brain rounds it down and feels like we got an epic deal. Sellers and the "perfect" exit When a stock rises from 180 to 195 and nears 200, many sellers place orders right at 200. "That’s a nice round number, I’ll exit there." There’s emotional satisfaction. The gain feels cleaner, more meaningful, when it ends on a round note. To be fair, I always suggest not waiting for an exact level like 200. If your stock moved through 145 > 165 > 185, don’t expect perfection. Leave room. A $190 target zone makes more sense. Often, greed kills profit before it can be realized. Don’t squeeze the lemon dry. Example: My Tesla analysis on TradingView with a $500 target — TESLA: Money On Your Screen 2.0 | Lock in Fully… Before & After: As you see there, the zone is important, not the exact number. ------------------------------------- Round numbers in breakout trades When price reaches a round number, the market often enters a kind of standoff. Buyers and sellers hesitate. The price moves sideways, say between 90 and 110. Psychologically, it’s a zone of indecision. The number is too important to ignore, but the direction isn’t clear until news or momentum pushes it. When the direction is up and the market breaks above a key level, round numbers work brilliantly for breakout trades or strength-based entries. Slide from my training materials People are willing to pay more once they see the price break through a familiar barrier. FOMO kicks in. Those who sold earlier feel regret and jump back in. And just like that, momentum builds again — until the next round-number milestone. Berkshire Hathaway (BRK.B) — every round number so far has caused mild corrections or sideways action. I’d think $500 won’t be any different. ------------------------------------- Conclusion: Simplicity rules the market Round numbers aren’t magic. They work because we, the people, make the market. We love simplicity, patterns, and emotional anchors. These price levels are where the market breathes, pauses, thinks, and decides. When you learn to recognize them, you gain an edge — not because the numbers do something, but because crowds do. A round number alone is never a reason to act. If a stock drops to 100, it doesn’t mean it’s time to buy. No single number works in isolation. You need a strategy — a set of supporting criteria that together increase the odds. Round numbers are powerful psychological levels, but the real advantage appears when they align with structure and signals. Keep round numbers on your radar. They’re the market’s psychological mirror, and just like us, the market loves beautiful numbers. If this article made you see price behavior differently, or gave you something to think about, feel free to share it. 🙌 So, that's it! A brief overview and hopefully, you found this informative. If this article made you see price behavior differently, or gave you something to think about, feel free to share it & leave a comment with your thoughts! Before you leave - Like & Boost if you find this useful! 🚀 Trade smart, VaidoEducationby VaidoVeek7727
Supertrend by MarsThis is the explanation of supertrend I wish I had seen ages ago. Great trading tool, but with caveats. Education15:02by marsrides3326
Honestly, I don't feel like explaining, the chart says it all !!Tesla's price can drop below $200 and then have a good increase. Give me some energy !! ✨We spend hours finding potential opportunities and writing useful ideas, we would be happy if you support us. Best regards CobraVanguard.💚 _ _ _ _ __ _ _ _ _ _ _ _ _ _ _ _ _ _ _ _ _ _ _ _ _ _ _ _ _ _ _ _ ✅Thank you, and for more ideas, hit ❤️Like❤️ and 🌟Follow🌟! ⚠️Things can change... The markets are always changing and even with all these signals, the market changes tend to be strong and fast!!Shortby CobraVanguard36
Tesla Is Retail Traders' Choice, JPMorgan Says. Are You Buying?Tesla NASDAQ:TSLA has endured a soul-crushing experience over the past three months or so. The stock is down 50% from the record high of $480 hit in December (more than $700 billion in market cap washed out). Even insiders have sold a big chunk of their holdings. But over the past three weeks (12 trading days to be precise), investment bank JPMorgan NYSE:JPM says, retail traders just couldn't get enough of it. Retail net buying activity in TSLA stock. Source: JPMorgan They’ve consistently been buying the dip, and then the dip of the dip and then… you get it. Every new dip is seen as a buying opportunity to the daredevils among us who try to catch a falling knife. In the latest issue of “Retail Radar” — JPMorgan’s weekly report revealing where the retail money is flowing — the banking giant traced a net $12.5 billion of retail cash poured into stocks or stock-related investments last week. As much as $4.2 billion went into ETFs (diversification, nice), where a cocktail of ETFs with a broad selection of stocks took the lion’s share along with some gold ETFs . Still, the big chunk of the pie went into individual equities — $8.3 billion of cold hard cash was injected into the retail-trading darlings Tesla NASDAQ:TSLA , Nvidia NASDAQ:NVDA and other Mag 7 members. 🤿 Buying the Dip Here’s what the bank said: “Single stocks accounted for +$8.3B of the inflow. TSLA (+$3.2B, +3.5z) and NVDA (+$1.9B, +1.1z) collectively contributed more than half, and the rest of Mag 7 contributed another $1B. Notably, they have been buying TSLA for 12 consecutive days, adding $7.3B in total.” The 3.5z and the 1.1z describe the standard deviation of the retail traders’ net flows compared to the 12-month average. (Keep reading, it gets even better.) Did you hear that? Tesla dominated the charts. Day trading bros have kicked in a total of $7.3 billion into Elon Musk’s EV maker over the past 12 cash sessions. It even won some praise from JPMorgan analysts who said this endeavor represents “the highest magnitude among all past ‘buying streaks’ in over a decade.” Here’s the best part: “Retail investors returned as aggressive buyers on Wednesday, breaking the $2 billion threshold in the first half of the day (the 2nd time this year), and ending the day at $3.7 billion inflows (+7z),” JPMorgan noted (Wow, 7 standard deviations above the mean). “We observed their allocation into ETFs/single names are at 30/70% during a typical heavy buying day. Among single names, NVDA and TSLA led the inflows.” JPMorgan also estimated that retail traders’ efforts to snatch the W this year are just bad. “We estimate retail investors’ performance is down by 7% year to date (vs. -3.3% loss in S&P). Most of the drawdown came from March as they increased their holdings in Tech.” Retail traders' performance, year to date. Source: JPMorgan 🤙 The YOLO Moment Buying Tesla shares right now is the ultimate YOLO play. We’re only a week away before Tesla announces what’s shaping up to be the worst delivery figure in years. After a few cuts to delivery targets, considering Europe’s sales took a huge L earlier this year, analysts now predict first-quarter deliveries to land at an average of 418,000 vehicles. Goldman Sachs NYSE:GS , for one, is bigly bearish on the number. It trimmed its target by 50,000 to 375,000 cars. If true, it would mean that Tesla’s business is shrinking by 3% compared with Q1 of 2024 when deliveries hit 387,000 units. For the year, analysts expect sales to land anywhere between 1.9 million and 2.1 million. With looming competition in the global auto space , Tesla will need to work extra hard to meet these numbers. In 2024, Tesla rolled 1.8 million vehicles off the assembly line and into customers’ hands (down 1% from 2023). 👀 Are Retail Traders Buying the Dip? What better place to gauge retail traders’ sentiment than the absolute best trading community out there? Let’s hear it from you — share your thoughts on Tesla! Have you been buying the dipping dip that just keeps carving out new lows? Or you’re a freshly minted Tesla bear after all the havoc and drama around Elon Musk? Off to you! by TradingView5252336
Tesla Bull Trap is copiumThere is currently 0% probably of a substantial breakouts in either direction. Tesla is crabbing and will likely continue to crab with high volatility until May. Nothing about the fundamentals has changed, and no technicals in terms of trend, volume, momentum, volatility and options chains suggests a reversal is nessary. The overall damage Elon has done to the brand is likely irreversible at this point. Sales in Germany are down I believe 90%, and more than 50% in the US, meanwhile in China BYD is dominating. Moreover, China or Germany could seize the gigafactory in retaliation for tarrifs if they wanted. That only leaves Texas and Nevada as manufacturing hubs on products without any sales. The promise of a fleet is a pipedream because FSD is not safe. Though this regime may push it through for Elon's benefit, it would only serve to incr3ase liabilities on their balance sheet and further damage the brand so it's not the moon shot he presents it to be. The entire brand was built on climate pledges and hope. The CEO has now endorsed big oil, he's running massive gas generators for AI, supports the regime that backed out of the Paris Agreement (again) and the protests are growing in momentum without any sign of slow down. In short TSLA is in the "find out" phase.by livingdraculaUpdated 2211
Tesla to SUB $200 then back to $500?! Here's WHY!Tesla - NASDAQ:TSLA A breakdown of this bear flag leads us right back to the massive multi-year inverse h&s diagonal retest. Breakdown = 🎯$169 by May2025⏳ Successful retest and bounce here takes us to the original inverse h&s mm of $546 🎯 by Mar2027⏳Shortby RonnieV291119
$TSLA RARE Fibonacci DIP BUY ALGOTESLA has retraced over 70% in past corrections SUB 200 would be a SWEET deal I am looking for 185 and a 6 figure play will alert yall step by step show me some LOVE I am currently long with my last buy at 237!Longby tradingwarzone1122
Massive Massive cup and handle on 1week chartAs you can see this is setting up to be a massive massive cup and handle on the 1week chart. It looks like the handle is almost complete. These next week or 2 can finish it and you can see a drop below 200$Shortby Stockdiddler241110
Tesla Analysis & Target.I have analyzed the chart based on the range, trend, chart pattern and There is high probability that price can come down further till Apple(Target). I have also considered one year price cycle in it.Shortby skumarinsweden16
Tesla's Tipping Point: The $662 Bet That Could Return $12K TSLA bearish play thesis focused on buying 2 contracts of the $190 PUT (May 2, 2025) at $3.31 each. This version scales up all profit/loss values and ROI calculations to reflect a 2-contract position (i.e., 200 shares total). 🧠 TSLA Bearish Earnings Thesis – 2 Contract Play Earnings Date: April 28, 2025 Option Expiration: May 2, 2025 Strategy: Buy 2x TSLA $190 PUTs @ $3.31 Total Cost (Premium Paid): $662 ($3.31 × 100 × 2) Breakeven: $186.69 Thesis: Multiple Converging Catalysts Suggest Sharp Downside Risk Tesla is facing a perfect storm of fundamental, technical, and sentiment-driven challenges. These create a highly asymmetric opportunity for short-dated PUT buyers heading into earnings. ⚠️ 1. Earnings Risk – Underperformance Expected Delivery Misses: Q1 delivery numbers fell short of analyst expectations. Slower ramp in key markets like China and Europe due to economic slowdowns. Margin Compression: Aggressive price cuts to maintain volume are eating into margins. Expectations for gross margin contraction YoY are high. Disrupted Guidance: Potential downside revision to full-year forecasts as competition heats up (BYD, Ford, Rivian, etc.). ❝ Street is pricing in perfection. Any earnings or margin disappointment could send shares sharply lower. ❞ 🧨 2. Brand Boycotts & Political Fallout Public Backlash: Tesla faces intensifying boycott pressure in parts of Europe and the U.S. due to Elon Musk's political affiliations and controversial stances. Brand Dilution: Musk’s polarizing presence has damaged Tesla's once-premium EV image. High-income, eco-conscious buyers are switching brands. Retail Sentiment Shift: Reddit, X (formerly Twitter), and retail forums show sharp decline in "diamond hand" loyalty. ❝ Tesla’s brand equity is eroding. Negative sentiment is now a structural overhang. ❞ 🔺 3. Headline Volatility – The “Musk Premium” Now a Liability SEC & DOJ Scrutiny: Multiple ongoing investigations. Any bad headline can crash the stock. X (Twitter) Overhang: Distraction and capital risk tied to Musk’s ownership of X are ongoing market concerns. AI Pivot Uncertainty: Musk’s recent AI pushes have created confusion about Tesla’s core vision, with no clear monetization path. ❝ Musk headlines, once a tailwind, are now a systemic volatility trigger. ❞ 📊 Modeled P&L for 2 Contracts TSLA Price on May 2 % Drop Option Value per Contract Total Value (x2) Net Profit ROI (%) $220 -16.5% $30.00 $6,000 $5,338 806% $210 -20.3% $40.00 $8,000 $7,338 1,108% $200 -24.1% $50.00 $10,000 $9,338 1,410% $190 -27.9% $60.00 $12,000 $11,338 1,712% $186.69 (Breakeven) -29.2% $63.31 $12,662 $12,000 1,812% $263.55 (No drop) 0% $0.00 $0 - $662 -100% 💡 Strategy Recap – 2 Contract Position Metric Value Strike $190 PUT Contracts 2 Premium $3.31 × 100 × 2 = $662 Breakeven $186.69 Max Risk $662 Max Reward $12,662 Reward/Risk Ratio ~19:1 ✅ Final Thesis (2 Contracts) "With $662 risked, a move to $200–$210 can yield ~$8,000. A move to $190 or below offers potential returns of over $11,000, making this a powerful short-term asymmetric play post-earnings. While risky, it’s tightly capped with a clearly defined thesis." Shortby TheHouseofTrade16
TESLA **SELL**TESLA Contain 3 patterns Douple Top Neck Line 700 Closing under it now Target of pattern 155$ Head and Shoulders Closing under Neck Line Target of pattern 156$ Bulish Crab Target 182 to 140 $ it strong Buy ZoneShortby IbrahimTarekUpdated 1110
TSLA Sitting on the Edge: Gamma Pivot or Breakdown? 🧠 Macro View: The Trump tariff shock sent waves across the market, particularly hitting growth and export-sensitive sectors. While NVDA and tech names dumped earlier, TSLA showed relative strength, bouncing near its high volume node — but this could change fast. 📊 Technical Analysis (1H Chart) Structure: * Price bounced from ~243 back toward 260, reclaiming key HVL. * But it failed to break through the 265–285 supply zone (Gamma Wall zone). * Now sitting on 260, a key equilibrium level. Levels: * Support: * 🔹 260 (Current HVL zone) * 🔹 250 – Gamma Put Support * 🔹 243.36 (recent low, key for invalidation) * Resistance: * 🔺 280 → Call Resistance / GEX Wall * 🔺 285–293 → Gamma ceiling, extremely difficult to break without institutional help Indicators: * Volume spiked on rejection from 280+, suggesting profit-taking or hedging. * TSLA must hold above 260 to avoid slipping into a liquidity vacuum toward 250 or lower. 🔥 GEX + Options Sentiment GEX Positioning: * GEX: 🔴🟢 — mixed but leaning negative * Call Walls: * 280 = Gamma Wall + Call Resistance * 285 = major rejection zone * Put Walls: * 250 = key dealer support * 245 & 240 = deeper magnets if panic resumes Options Oscillator: * IVR 67 → High implied volatility rank, meaning traders are buying premium. * IVx avg 87.2 vs current IVx (-0.35%) → indicates elevated fear is still embedded. * Call$ 23.6% → neutral-to-bearish skew (not heavily bullish) 🧭 Trade Setups 🐻 Bearish Breakdown: * Entry: Breakdown below 260 + confirmation with volume. * Target: 250 → 243 (Put wall & previous swing low) * Stop: 266+ * Catalyst: Further macro deterioration (tariff escalation, weak futures) 🐂 Bullish Bounce: * Entry: Bounce from 260 with reclaim of 265. * Target: 280 → 285 test (but high risk) * Stop: Close below 258 * Watch: Strength in QQQ or SPY supporting the move 📌 Final Thoughts: TSLA is at a tipping point. The Gamma wall at 280 caps upside unless we see an unwinding of fear. Dealers are likely short gamma below 260, and if 260 cracks, their hedging will accelerate the downside to 250–243. This is a reaction zone, not a trend zone** — trade lightly and watch for traps. ⚔️ Trade Idea: Buy 250P (1–2 week expiry) on breakdown below 260 Alt: Scalper can try 260C if market shows strong bounce and reclaim 265 with volume Neutral bias till clear break of 260 or reclaim of 265+ This analysis is for educational purposes only and does not constitute financial advice. Always do your own research and manage your risk. by BullBearInsights114
My version of the Relative Strength IndicatorI wanted to build something less choppy and more actionable, so there you go.Education08:08by marsrides2217
INVERSE CUP AND HANDLE $TSLA TO $120 The inverted cup and handle, also known as the upside-down cup and handle pattern, is a bearish chart formation that can occur in both uptrends and downtrends. Unlike the traditional bullish cup and handle pattern, this inverse pattern features two key components: the "cup," which forms an inverted U-shape, and the "handle," a brief upward retracement following the cup. Sell NASDAQ:TSLA right now with fact check: brand reputation risk, high competition, loss of EV market leadership, cyber truck/ product recalls, declining sales with lower margin, stock volatility concern, insider selling, investors buy it based on expected future earnings rather than its current profitability. + Head and shoulder/ inverse cup and handle, P/E ratio 79.8-161.23 (overpriced), falling knife, dead cat bounce, the lowest target estimate stands at $120.00, below the 50-day, 100-day, and 200-day moving averages, MACD indicator is -19.8, bearish signals. + potential stagflation, tariff war, slow economic growth, inflation, rising public debt, geopolitical tensions, ai bubble, and more Shortby sej497414
Tesla to bounce from hereNASDAQ:TSLA Tesla has reach and bonce from a key support level, as seen on the chart, in the Golden Pocket, between the 61.8% and the 78.6% Fibonacci Retracement, and it is shown two weekly hammer candlestick bar near each other, which is bullish. Odds that it has already found a mid-term bottom is high. Now I expect a multi-week bounce from here, probably to the next Golden Pocket at the top, which is between $385 to $430 USD. And yes, Elon Musk upset his customer base, and the stock is very expensive compared to other car manufacturers, and will probably see little to no growth in sales this year, or even a decline, insiders has sold big amounts of shares and it is all looking bad. And yes, we have probably already seen the top in Tesla in December last year for a long time. However, stocks don’t generally go down in a straight line, the stock, as well as the stock market in general is oversold and do for a bounce, maybe a big bounce. After the bounce, I will be looking for shorts, but now, I’m looking for longs. Good luck to you Longby Raul_DominguezUpdated 337
TESLA Tesla stock drops owing to Elon political involvement in united states politics, and the rise of china EV market with BYD AND HUAWEI LEADING BACKED BY CHINESE GOVERMENT . the on going tariff will crush tesla market shares and revenue.Short08:59by Shavyfxhub7
TSLA watch $253.47 (again) Golden Genesis fib to determine trendTSLA back to the Golden Genesis fib that we keep harping about. This is a BIG deal, as the most important level of this epoc for it. Many PINGs (exact hits) have made all traders keenly aware of it. What happens here will say a LOT to a LOT of traders and algos. ========================================================= Full view of the "Genesis Sequence" ========================================================= by EuroMotifUpdated 6
HOLY MOLY! ARE WE IN A RECESSION? $TSLA $120 BEAR FLAG PATTERNA bear flag trading pattern is a technical analysis formation that features a downward-sloping flagpole, followed by a consolidation phase forming a parallel channel. This pattern suggests a potential sharp decline or continuation of the downward trend I also notice a head and shoulders pattern, as well as an inverse cup and handle. Everything points to $120. Sell/Short NASDAQ:TSLA right now with fact check: +brand reputation risk, high competition, loss of EV market leadership, cyber truck/ product recalls, declining sales with lower margin, stock volatility concern, insider selling, investors buy it based on expected future earnings rather than its current profitability. + potential stagflation, tariff war, slow economic growth, inflation, rising public debt, geopolitical tensions, ai bubble, and more Shortby sej4974Updated 9
$TSLA - A Sustained Breach of $269 Opens the Path for A Gap FillNASDAQ:TSLA - NASDAQ:TSLA - A sustained breach of $269 opens the path for a gap fill towards 250-244. Shortby ImpulsiveWaveTradingUpdated 9