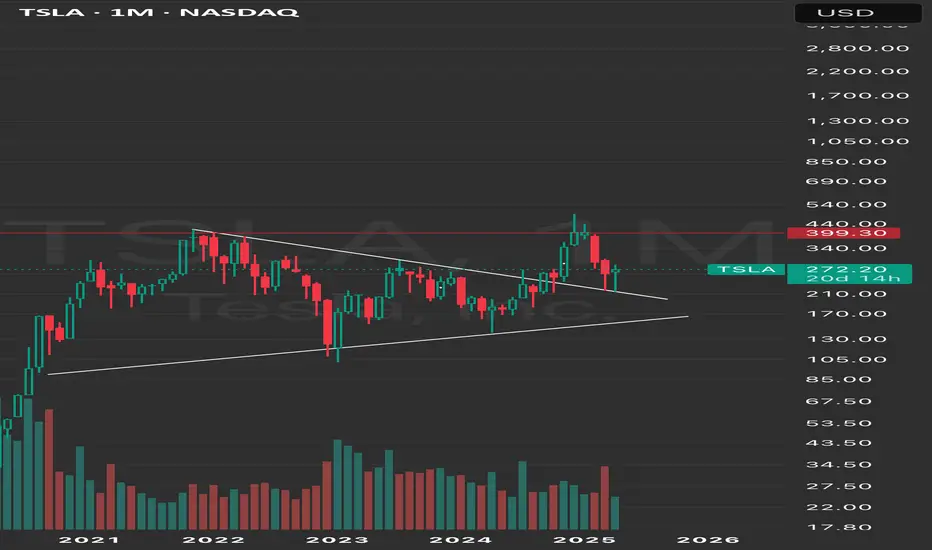
TSLA - Double Top To Stronger Trend LineA long term trend line going to be tested as a result of a large double top forming
I expect price to rebound very strongly from this long term green trend line
Short - mid term bearish
Long term very bullish
Weekly timeframe
TL0 trade ideas

TSLA sideway then downTSLA sideway up a little bit then turn down.
Maximum target price this time soon $299.29. Because the volume so high.
But in frame Day, MA50 start cross down with MA200. TSLA will in correction.
At least will go back to $214.25.
IMO amateur trader.

Hold TeslaTesla's shares are no longer excessively expensive, but they are still not cheap. 😅
Hopefully, we can see the price closer to $240 amid all the negativity. 🤞📉

TESLA BULLISH 14th April 2025Do not blindly trade anything without maanging your risk.
If market supports then I am expecting a green candle in Tesla.
Again please do not blindly trade anything ever. Hope this helps and yes I am long

TSLA 4H Analysis: Technical Outlook1. Price Structure and Trend:
TSLA has been in a clear downtrend since January 2025, dropping from ~$475 to a key support at ~$258. The price is currently consolidating at this level, hinting at a potential pause or reversal.
2. Support and Resistance Levels:
• Support: $258 (current level, with multiple bounces).
• Resistance: $300 (next significant zone, based on prior consolidation).
3. Volatility and Squeeze Indicators:
The "Volatility Squeeze" indicator (on the right) shows red and blue bars. Recent red bars signal a squeeze (low volatility), often preceding sharp moves. The shift to blue bars suggests volatility may be increasing.
4. Action Signals:
• "X" markers (blue and orange) highlight potential entry/exit points. Recent orange "X" marks at the $258 support could indicate a buying opportunity if the price confirms a bounce.
• If support breaks, the next level to watch is ~$225 (previous lows).
5. Conclusion:
TSLA is at a critical juncture. A bounce from $258 could target $300, but a breakdown might lead to $225. Keep an eye on volume and volatility for confirmation. What's your take?
Here is the link to the indicator

TSLA at a Crossroad: Can 252 Hold or Will It Crack?🔍 Technical Analysis (1H Chart Overview)
TSLA has formed a symmetrical triangle, compressing between an uptrend and a downtrend line. Price is hovering right near the apex, with a key horizontal level at $249.89, where it's showing indecision.
* Support levels:
* $239.67 → Previous demand zone
* $217.11 → Major swing low and last defense for bulls
* Resistance levels:
* $257.85 → Overhead rejection zone
* $276.91 → Major gamma wall and swing high
Volume is thinning out as price coils tighter, suggesting a breakout is imminent.
The RSI is neutral around 50, slowly curving upward, signaling slight bullish momentum building, but no confirmation yet. Price is consolidating on declining volume, which is often a pre-breakout setup.
🔧 Trading Bias:
Watch for breakout above $253 for potential long play toward $258–$265.
Breakdown below $249 flips bias bearish, with a retest of $239 then $230 likely.
⚙️ GEX Option Flow Insights
GEX data shows concentrated gamma resistance at $275–$280, with the highest positive NETGEX sitting right at $275 — that's our Gamma Wall. Above that, market makers become forced buyers, creating a squeeze scenario.
On the downside, there’s a strong PUT wall around $220 and $200, with -50.27% NETGEX at $200 acting as deep support.
Notably:
* IVR: 67.2
* IVx Avg: 108.9
* Call Flow: 15.2%
* GEX Sentiment: ☘️☘️🟢 (Bullish tilt, but not maxed out)
💡 Options Strategy Suggestion:
Consider a debit call spread if price breaks $253 with volume, targeting $265–$275.
If price breaks $249, put debit spreads to $230–$220 could offer solid reward.
🧠 Final Thoughts
TSLA is a coiled spring, and both TA and GEX show we’re at a key decision point. Let price tell you the story — react to breakout or breakdown. Gamma positioning offers high reward potential in both directions.
📌 Stay nimble, plan both scenarios, and use options to your advantage.

Tesla Long Longseems like we are done with those lower prices; this week´s target is $305.
as you can see the SL and TP
GL

Quantum's TSLA Trading Guide 4/13/25Sentiment: Neutral. EV and AI optimism persists, but tariff risks and high valuation concern traders. Chatter split—bulls eye robotaxi, bears see pullback.
Outlook: Neutral, slightly bearish. Options pin $250, with $240 puts active. ICT/SMT eyes $245-$250 buys to $260 if $245 holds. Bearish below $245 risks $240.
Influential News:
Federal Reserve: Two 2025 cuts support growth stocks, positive for $TSLA.
Earnings: Q1 due late April; no update today.
Chatter: Debates tariff impact vs. AI/EV growth.
Mergers and Acquisitions: None; focus on internal projects.
Other: Tariff volatility hit NASDAQ:TSLA ; stock swung (April 3-9).
Indicators:
Weekly:
RSI: ~50 (neutral).
Stochastic: ~45 (neutral).
MFI: ~40 (neutral).
SMAs: 10-day ~$255 (below, bearish), 20-day ~$260 (below, bearish).
Interpretation: Neutral, bearish SMAs signal weakness.
Daily:
RSI: ~48 (neutral).
Stochastic: ~50 (neutral).
MFI: ~45 (neutral).
SMAs: 10-day ~$255 (below, bearish), 20-day ~$260 (below, bearish).
Interpretation: Neutral, bearish SMAs suggest pullback.
Hourly:
RSI: ~45 (neutral).
Stochastic: ~55 (neutral).
MFI: ~50 (neutral).
SMAs: 10-day ~$255 (below, bearish), 20-day ~$260 (below, bearish).
Interpretation: Neutral, stabilizing.
Price Context: $252.31, 1M: +1%, 1Y: +38%. Range $240-$270, testing $250 support.
Options Positioning (May 2025):
Volume:
Calls: $260 (15,000, 60% ask), $270 (12,000, 55% ask). Mild bullish bets.
Puts: $240 (10,000, 70% bid), $245 (8,000, 65% bid). Put selling supports $245.
Open Interest:
Calls: $260 (40,000, +7,000), $270 (30,000, +5,000). Bullish interest.
Puts: $240 (25,000, flat), $245 (28,000, +4,000). Hedging. Put-call ~1.0.
IV Skew:
Calls: $260 (40%), $270 (42%, up 3%). $270 IV rise shows upside hope.
Puts: $240 (35%, down 2%), $245 (36%). Falling $240 IV supports floor.
Probability: 60% $240-$270, 20% <$240.
Karsan’s Interpretation:
Vanna: Neutral (~300k shares/1% IV). IV drop could pressure $250.
Charm: Neutral (~150k shares/day). Pins $250.
GEX: +50,000. Stabilizes range.
DEX: +7M shares, neutral.
Karsan view: GEX holds $240-$270; tariff news key.
ICT/SMT Analysis:
Weekly: Neutral, $240 support, $270 resistance. No $TSLA/ NYSE:NIO divergence.
Daily: Bullish at $250 FVG, targets $260. Bearish < $245.
1-Hour: Bullish >$250, $260 target. MSS at $245.
10-Minute: OTE ($249-$251, $250) for buys, NY AM.
Trade Idea:
Bullish: 50%. ICT/SMT buys $245-$250 to $260. Options show $260 calls. Fed cuts aid.
Neutral: 35%. RSI (~50), SMAs (bearish), $240-$270 range.
Bearish: 15%. Below $240 possible with tariffs. $240 put volume grows.

Dageedoo Follower Request $TSLA close up #Internals You saw how this very similar W/double bottom on #61fib worked out on AAPL... This is a 50% retrace W... I prefer #61 retraces, but with TSLA im not surprised with some extra volatility. Go with the flow... 186 first level to break, 198 next stop. then if strong enough hammer on 198 200 critical level breaks 10+ and youre at 220 like AAPL hit and people profit take.
Below redline or Diamond mid point (176) idea is DEAD.
LESSON TIME; Critical level breaks can bring quick moves 10-20% in a few days. I'm always "eyeing" critical levels on "Big Name/Mega Cap" stocks... ie; FB 500+ , would you believe me if I was "eyeing" AVGO under 1500... you wouldve caught splits on that n NVDA with critical levels in mind (1000 crit level for NVDA)... 3 big stocks all breaking through with these methods is not as strong as some might think, short term yes, long term questionable. Not everything is a critical level/ price "number" and markets psychology help determine these, usually round, usually act as resistance or support prior, see AAPL W... 1 2 3strikes then through at the old stock game...
LESSON CONT; I have a very unique set of tools. Tools I have acquired over many years. Tools that make me a nightmare for women who want a man with a "normal" job. Tools like Fibonacci Retracements, Technical Patterns, RSI, Stoch, Multiple Timeframes (3Day is my fav), and Bollinger Bands with MAs. Be sure you find your own trusted tools. Because I will be here, I will find the patterns, and I will execute them.
-Good Luck - Prof

TSLATSLA still have some upside, we will see the reaction above 295.
Disclosure: We are part of Trade Nation's Influencer program and receive a monthly fee for using their TradingView charts in our analysis.

Tisk Tisk TSLAShort thoughts on a neutral area. TSLA broke out of what appears to be bear flag to me. I also see an inverse cup & handle. We may attempt to retest and/or regain the channel. If we fail, 225-220 is my target. Demand zone marked. More journal notes this week to stay focused on the trade(s).
Bear Flag:
www.bapital.com
Cup & Handle:
www.investopedia.com
Inverse Cup & Handle ( from our very own Trading View):
youtu.be

TSLA resuming downtrend target the same 155TSLA weirdo
Monday will be a good day to load up on shorts again
Still target 155

GEX Analysis & Options “Game Plan”🔶 Short- and longer-term perspective in a high IV, negative GEX environment
🔶 KEY LEVELS & RANGES
Spot: 221
Gamma Flip / Transition: around 250 (the turquoise zone on the chart)
– This zone typically marks a “power shift.” If price decisively breaks above 250 and holds, market makers’ gamma positioning could flip from neutral/negative to positive.
Put Support: 200
– A large negative gamma position has accumulated here, making 200 a strong support level. If it breaks, the downside may accelerate.
Call Resistance: 400
– A major long-term “call wall” where a significant amount of OTM calls are concentrated. It’s more relevant to LEAPS; currently far from spot, so not a realistic short-term target.
Call Resistance #2: 300
– A medium-term bullish objective, still above the 200-day MA. You’d need to be strongly bullish to aim for ~300 by May (e.g., going for a 16-delta OTM call).
Short-Term / Intermediate GEX Levels:
– There are gamma clusters around 220–230 and 250–260 . These areas often see higher volatility, possible bounces, or stalls (chop) due to hedging flows.
🔶 WHATEVER SCENARIO – SHORT TERM (0–30 DAYS)
A) Upside Continuation / Rebound
– If TSLA closes above 225–230 , the next target is 240–250 (transition / gamma flip).
– If it breaks above 250 and holds (e.g., successful retest), market makers may shift to “long gamma,” fueling a quicker move to 260–270 .
– Resistance: 250, 300, with an extreme LEAPS-level at 400.
B) Downside Move / Bearish Break
– If price dips below ~220 and sustains, the next targets are 210–200 (major put wall / negative gamma).
– If 200 fails, negative gamma may magnify the sell-off. It’s an extreme scenario but still on the table given high IV and macro/geopolitical risks.
– Support: 210, 200 — likely stronger buying interest near 200, possibly a short-term bounce.
– The options chain suggests near-term hedging via puts for this scenario.
C) Chop / Sideways
– If TSLA stays in 210–230 , market makers (short options) might benefit from high IV/time decay.
– Negative GEX, however, can trigger sudden moves in either direction; caution is advised.
🔶 LONGER-TERM FOCUS (6–12 MONTHS, LEAPS)
NET GEX = -61.97M (negative territory) suggests longer-dated positioning is also put-heavy or carries notable negative gamma.
HVL / pTrans = 250 is a key pivot; cTrans+ = 400 is distant call resistance. Between these levels, there’s a mix of put/call dominance.
If Tesla undergoes a fresh growth phase (AI, robotaxi, energy storage, etc.) and clears 250/300 , 400 could become the next significant call wall — but that’s more of a multi-month horizon.
🔶 STRATEGY IDEAS (High IV Environment)
1. Short-Term Bearish
– If you’re bearish and expecting TSLA to test 220–210, consider a bear put spread or net credit put butterfly (lower debit) to leverage high IV.
– Targeting 200, but keep in mind negative gamma may accelerate downside movement.
2. Medium-Term “Contra” Bullish (bounce to 250)
– If GEX suggests a bounce off 210–220, consider a bull call spread (e.g., 220/240) or a net debit call butterfly (220/240/250).
– Be mindful of sudden swings, as we remain in negative gamma territory.
3. Longer-Term Bullish (>3–6 months)
– A call butterfly with upper strikes around 300–350 offers capped debit and higher potential payoff if a bigger rally materializes.
– A diagonal spread (selling nearer-dated calls, buying further-out calls) exploits elevated front-end IV.
4. Neutral / Range-Bound
– If TSLA stays in 200–250 , you could use Iron Condors (e.g., 200/260) to benefit from time decay and any IV collapse.
– Exercise caution: negative gamma can generate abrupt, directional moves, making a neutral stance riskier than usual.
🔶 ADDITIONAL NOTES & “BIG PICTURE”
High IV & Negative GEX: TSLA has a track record of large swings. Negative GEX can intensify sell-offs, while forced hedging might trigger rapid rebounds.
Preferred Structures: With expensive premiums, spreads (vertical, diagonal) and butterfly configurations generally fare better than plain long options (less vulnerable to time decay).
Potential Catalysts: AI announcements, Autopilot breakthroughs, new product lines, and macro changes can swiftly alter market dynamics. Keep tracking GEX updates and news flow; TSLA tends to respond dramatically to fresh developments.
🔶 Bottom line: From 221 spot, watch 210–200 on the downside and 240–250 on the upside short term. Medium-term bullish target = 300 , while 400 remains a far LEAPS scenario. High IV + negative gamma = fast, potentially volatile moves — so risk management and spread-based approaches are crucial.

Tesla Shares Tumble 7%+ Following Cybertruck Quality ComplaintsTesla Inc. (NASDAQ: NASDAQ:TSLA ) faced another sharp sell-off on Thursday 10th. The stock dropped 7.27% to close at $252.40, down $19.80 for the day. However, volume was high, reaching 399.04 million shares.
The fall followed reports of build quality issues in Tesla’s Cybertruck. Owners posted complaints on the Cybertruck Owners Club forum. Several noted that the vehicle’s metal panels had detached.
Additionally, videos showing Cybertruck damage in cold weather gained attention on social media site X. These reports raised concerns over production quality.
Tesla had been recovering before the recent plunge. However, concerns about product reliability appear to have paused the rebound.
Technical Analysis
The 3-day chart shows Tesla in a strong downtrend. The stock broke below $290, triggering a drop to around $220 before bouncing back to $252. Price recently respected a key support near $190m, which may act as a floor for future declines. High volume near support signals buyer interest. If Tesla breaks above $290, it could retest $300. That zone acts as resistance and aligns with the 50- and 100-day moving averages at $252 and $232, respectively.
The longer-term target is near $488, but the price must clear $290 first. A failure to hold support near $220 could send the stock back toward $180. The RSI is at 42.77, slightly above oversold. Momentum is weak but may shift if price builds support above $250. Tesla’s next move depends on how it manages both technical resistance and consumer concerns.

TSLA - Rebound From Major SupportBullish Divergence along with Marubuzo candle formed.
High Probability for a bullish breakout
What Do You Think

HammeringWe are holding above a 2 year old resistance. It had extensively been exceeded in November last year and as fast retraced this year so far.
This looks as we have reached a level of market balance now.
The candle stick Hammer may now hammer out this resistance as the new long term bottom.

TESLA: DOESN'T GET MUCH SIMPLER THAN THISThe downtrend is obvious, clear, and well defined. The long term downtrend will continue for the foreseeable future.
Maybe if this company changes its CEO, that will inspire confidence in the stockholders

TSLA next 240 then 240Bear Flag breakdown on 15m chart
If we break down the 50% fib then TSLA
has chances to go all the way back to yesterday's low
Market not showing any kind of trust in this bull move

Tesla (TSLA) Shares Jump Approximately 22% in a Single DayTesla (TSLA) Shares Jump Approximately 22% in a Single Day
Tesla was among the standout performers in the stock market rally that followed President Trump’s decision to delay, by 90 days, the implementation of new international trade tariffs — with the notable exception of China. According to the charts, Tesla (TSLA) shares surged by approximately 22%.
Why Did TSLA Shares Soar?
Some insight comes from Cathie Wood, CEO of asset management firm ARK Invest.
In an interview with Barron’s on Wednesday, she noted the following:
→ Tesla plans to launch a new, more affordable vehicle this quarter, likely priced at around $30,000 — roughly half the cost of the base Model Y.
→ The upcoming release of Tesla’s robotaxi service could also lower the need for large upfront vehicle purchases, offering consumers a more economical alternative.
→ Tesla sources more components from North America than most other US carmakers, meaning it is less exposed to tariff-related costs.
And there’s another reason TSLA may have jumped — one that can be found in the chart.
Technical Analysis of TSLA
Take note: the March and April lows (marked with arrows) are both around the $220 level. Meanwhile, the S&P 500 (US SPX 500 mini on FXOpen) posted a significantly lower low in April compared to March. This suggests that, in early April, TSLA was outperforming the broader market. Why?
One possible explanation is that there has been — and perhaps still is — a strong accumulation interest in TSLA. Buyers may have been quietly scooping up available shares amid recession fears. When yesterday’s news suddenly shifted market sentiment, the “spring” uncoiled, catapulting TSLA’s share price upward.
However, the overall downtrend remains intact. If bullish momentum continues, the price may encounter resistance around the psychologically significant $300 level — which coincides with the upper boundary of the downward channel.
This article represents the opinion of the Companies operating under the FXOpen brand only. It is not to be construed as an offer, solicitation, or recommendation with respect to products and services provided by the Companies operating under the FXOpen brand, nor is it to be considered financial advice.

TSLA in the coming monthsBased on my analysis using three-month candlestick charts, TSLA is not in a bear market yet. It may test the 202 level and possibly even dip to the 168 area. However, as long as it holds above that range, the outlook remains positive.
The market may be choppy in the coming months, which could present some solid trading opportunities.
Good luck to us all!

TSLA. Are we buying the dip?Retest on weekly/monthly trendline with clear as day bounce. Market sentiment shifted today with it being one of the best days since 2008 I believe. I consider i’m all in on a swing.
TSLA 45M chart - BULL flag Coiling for Breakout!www.tradingview.com
🚀 TSLA 45m – Bull Flag Coiling for Breakout
NASDAQ:TSLA TSLA ripped from $214 → $276 📈 and is now forming a bull flag just under resistance at $276.87.
🔹 Strong volume on the pole, cooling off during flag 🧊
🔹 RSI ~74 — strong, but not overheated 💪
🔹 MACD crossover 🔄 + momentum building 📊
🔹 Above all key EMAs (20/50/100/200) 🟢
🔹 OBV trending up — smart money is loading 💼📦
⚠️ Breakout above $277 = launch toward $293–$300, with extended target of $310–$330 if trend continues.
❌ Invalidation below $263.
📌 Watching for a breakout + retest entry 🔁
Let it cook. 🔥

Tesla Taps the Golden Zone – Is the Launch Sequence Engaged?Tesla (TSLA) has shown textbook precision by respecting the golden zone after a significant sweep of previous highs. Rather than violating the last HTF low—which would’ve hinted at deeper downside—price instead retraced cleanly into the OTE (Optimal Trade Entry) range and reacted with strong bullish intent.
This move indicates a healthy retracement rather than weakness, suggesting a continuation to the upside. Confirmation of this potential bullish leg would be a sustained close above the 272–300 level, which aligns with previous buyside liquidity zones and Fibonacci confluence.
Key Observations:
- Golden Zone respected: Price bounced cleanly between the 62–79% fib levels.
- HTF low protected: No violation of higher timeframe bullish structure.
- Volume spike supports the reversal move.
Targets:
- Short-term: 300.61
- Mid-term: 416.67
- Long-term swing: 861.17 (over 255% potential gain)
Conclusion:
Tesla looks set for lift-off 🚀. The reaction at the golden zone and the preservation of structure give high confluence for a potential explosive move higher. Wait for confirmation via price continuation and structure integrity.
As always — DYOR (Do Your Own Research).
