TESLA STOCK CRASH ANALYSIS
after a rough start to March, I have discovered a glaring sign we missed in the charts. The classic pattern - Starship coming in for landing. Obvious in hindsight, but don't worry tesla bulls. This rocket will be ready for another launch any day now
TL0 trade ideas

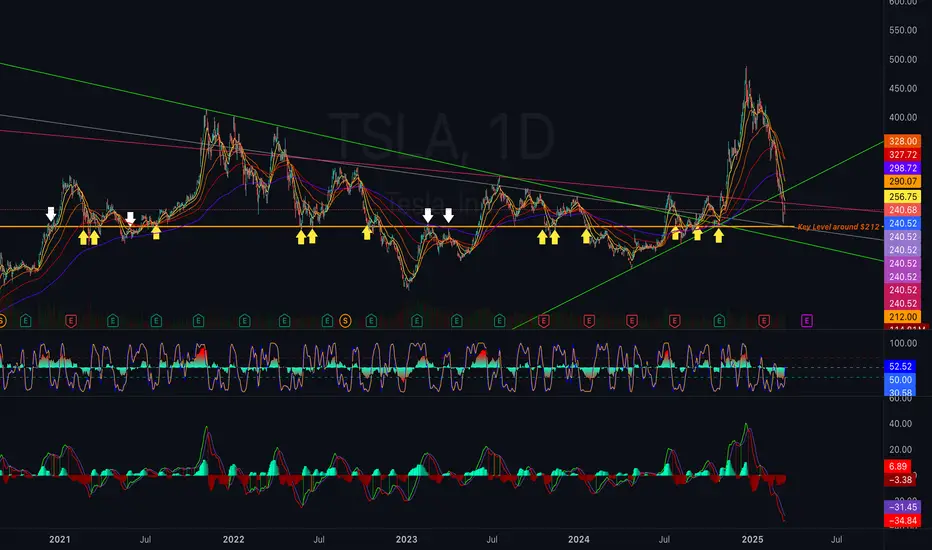
TSLA when shareholders protest1. Key Observations from the Chart:
• Recent Selloff: TSLA has seen a significant decline from its recent high near $480 and is currently testing key support zones.
• Major Support & Resistance Levels Identified:
• Resistance Levels:
• $256.75 – Previously strong support, now acting as resistance.
• $290.07 – Another key resistance level (previous major pivot).
• $327.72 - $328.00 – Strong confluence zone, likely to reject price if tested.
• Support Levels:
• $240.68 – Testing this zone right now.
• $212.00 - Key Long-Term Support Zone (Highlighted on the chart, critical level).
• Below $212.00 could mean significant downside risk.
⸻
2. Trend Analysis & Chart Patterns
• Downtrend Confirmed: Price is clearly moving lower, with the 200-day EMA and trendlines confirming bearish pressure.
• Testing Key Support ($240.68) : If this breaks, the next major support is around $212.00.
• Descending Resistance Line (Green Line) Could Act as Rejection If Price Bounces.
⸻
3. Indicator Analysis
Stochastic RSI (Middle Panel - Momentum Indicator)
• Currently near neutral levels (~52.52)
• Not oversold yet, meaning TSLA could still see more downside before a true bounce.
MACD (Bottom Panel - Trend & Momentum)
• Bearish MACD Cross Confirmed:
• MACD histogram is deeply negative, signaling strong selling momentum.
• No clear signs of reversal yet.
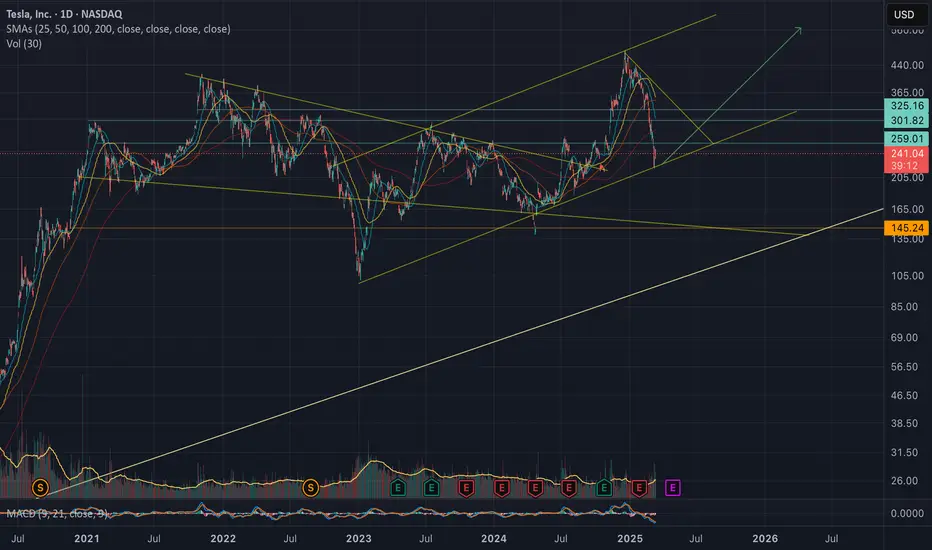
TSLA Volume profile clearly shows bubble regionTesla is an interesting case study for volume profile. the whole bubble region is clearly visible.
I am deeply in love with volume profile. and I intend to post more of these type of analysis

$TSLA Triple Threat: Bounce or Bust?Yo, let’s dive into Tesla (TSLA) on this daily chart—things are heating up big time! The stock just smashed its “head and shoulders” reversal target, dropping to around $240.68 as of March 13, 2025, with a solid 2.99% dip for the day. And check this—it nailed that golden Fibonacci retracement level like a pro, while also filling a previous gap like it was no big deal. That’s three powerhouse signals right there: a textbook reversal pattern, a perfect Fib hit, and a gap fill—talk about a triple threat! This setup’s got some serious juice, and it’s screaming potential for a pause or bounce. But hold up—keep your eyes peeled and stay cautious, fam. With P/E running high and the market vibe feeling kinda low, those lofty valuations might not get the love they need to push higher just yet. Let’s watch this beast closely!

Tesla’s Next Big Rally: The Elliott Wave 2.0 PerspectiveTesla (TSLA) is at a critical inflection point, and according to Elliott Wave 2.0 analysis, the stock is primed for a powerful move higher. Currently trading around $250, TSLA appears to be completing its 4th corrective wave, setting the stage for a major 5th wave rally that could propel the stock toward $500 to $600 in the coming months.
Why Tesla’s Next Leg Higher is Unstoppable
1. Elliott Wave 2.0: The Perfect Bullish Setup
Under Elliott Wave 2.0 analysis, Tesla has been in a classic sharp corrective phase and is now positioned for a parabolic 5th wave breakout. This means that the previous pullback was merely a setup for the next impulsive move higher, which could surprise even the most conservative investors.
2. Full Self-Driving (FSD) – The Revenue Explosion
Tesla’s FSD technology is nearing widespread adoption. With each software update, Tesla’s AI-driven self-driving system becomes more refined. A successful rollout of FSD could open up a multi-billion-dollar recurring revenue stream, significantly enhancing Tesla’s margins and valuation.
3. Humanoid Robots – The Next Mega Catalyst
Beyond EVs, Tesla is revolutionizing robotics with Optimus, its humanoid robot. If successfully commercialized, Optimus could disrupt industries ranging from manufacturing to home assistance, potentially adding trillions to Tesla’s long-term valuation.
Tesla’s Road to $600: A Rare Opportunity
The confluence of a bullish Elliott Wave setup, major technological breakthroughs, and growing institutional demand makes TSLA one of the most compelling investments of this decade. Investors who recognize this pattern early could see substantial gains as the 5th wave rally takes off.
🚀 Are you positioned for Tesla’s next explosive move?

TSLA - Buy the Dip!Despite the political backlash ~ This is a great DIP for TSLA
TSLA broke ATH and has potential for $500 by EOY
Business fundamentals are still strong
and most importantly, they now have the president in their pocket
Bullish!
TSLA ! You like money? You like money ?We're here to make money! I don't care about politics or idealists. If TSLA makes +20% in the next few weeks, I'll be very happy! End of story. I only do technical analysis. No emotions here.
hedge funds, YOUR pension funds and market makers have to pay themselves! They're buying the dip, while you're watching the stock collapse! Wake the hell up!
Some troll here haha

Let's discuss the TESLA 'deep dive'...A lot of people are stressing about $TESLA.
Why is it down close to 50%, in just a few months?
Here, a detailed view about the reason, and why it's still bullish...
A potential good price to buy at these levels!

TESLA road map !!!Tesla's price can drop below $200 and then have a good increase.
Give me some energy !!
✨We spend hours finding potential opportunities and writing useful ideas, we would be happy if you support us.
Best regards CobraVanguard.💚
_ _ _ _ __ _ _ _ _ _ _ _ _ _ _ _ _ _ _ _ _ _ _ _ _ _ _ _ _ _ _ _
✅Thank you, and for more ideas, hit ❤️Like❤️ and 🌟Follow🌟!
⚠️Things can change...
The markets are always changing and even with all these signals, the market changes tend to be strong and fast!!

TESLA Imagine if news were fake to fill priceImagine that the market always fills gaps and in order to do it they create constant fake news to balance everything out.
If that was true @214/238 is a gap to be filled
Then we go even lower to $145/157
But only IMAGINE if someone dare to fake situations to balance this out.
Crazy thought, right? right? right? I don't hear anyone saying "yeah"

TSLA Chart Analysis and Predictions.TSLA
TSLA is possibly on its way to retest 100D EMA and 200D EMA before further downtrend. Important levels to be watched for, 273, 300, 325.

TSLA has bottomed. Great Rebound spot!!!TSLA ran up from 200 to 475/shr. On its way up it left to gaps in its price action, one gap up to 245 and another one right after to 275. Gaps in price action are eventually filled 90% of the time. During TSLA's recent decline, it pushed all the way down to close the gaps it had in its chart, with the bottom being 220, where the inital gap started.
Now that it has had its rundown and closed its gaps in price action, its likely this is the bottom for TSLA and it'll rebound from here.

Tesla AnalysisI have analyzed Tesla based on the trend, candle pattern & Gann system. It is in downtrend. Target is still intact and stop loss is mentioned.

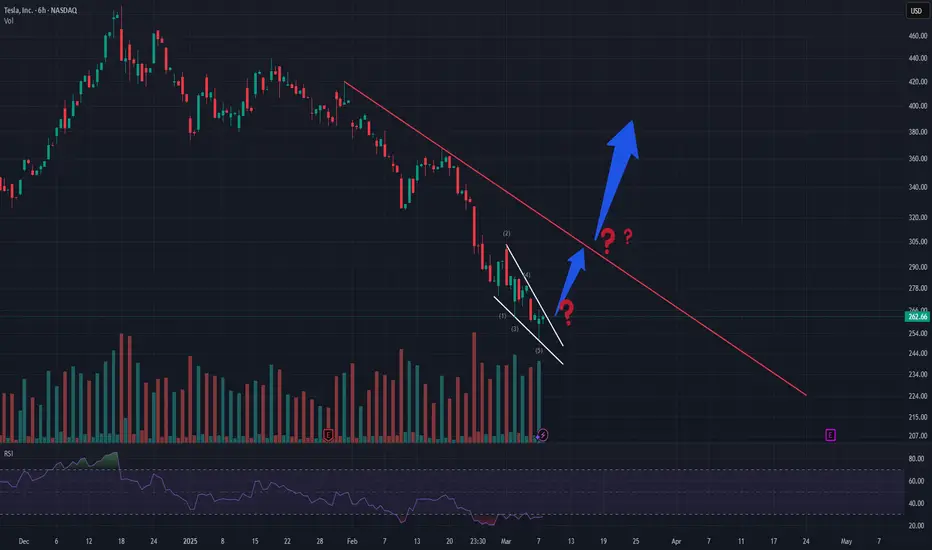
A Clear Target for Tesla?If Tesla breaks the small white descending trendline, its first target could be to test the main trendline. Monday’s price action should be watched closely, as a false breakout is possible. However, if the small trend is successfully broken, Tesla could see a 10% upward move before hitting the main trendline.
If the price reaches the main wave and manages to break through, a new all-time high (ATH) could be on the horizon. 🚀
Your Stock, My Analysis – Key Levels Straight to Comments!Hey-hey
I want to give back to this amazing community! If you need a technical analysis (TA) on almost any asset, here’s all you have to do:
📌 Like this post & Follow me
📌 Comment your ticker
📌 Tell me what you want – Buying zones? Selling zones?
I’ll personally send you my TA straight to comments as soon as possible! 📩
Let’s spot the best setups together – Drop your request below! 👇
💡 Does Technical Analysis Work?
🔗 I picked 75 stocks from the S&P 500 purely based on technicals – and they outperformed the index.
Cheers,
Vaido

TESLA LONG TRUMP GOLDEN ERA ?? still looking at Tesla dropping to 160 where it could find a good demand level before rallying back to take out the highs 488.. This is weeks and months worth of price action . Drop a comment on what you think

TSLA : A Brief Respite or the Start of a Comeback (Wednesday 12)Overview:
At the time of writing, the stock is hovering around $215, barely holding on to that level. The next significant support aligns with the lower boundary of my descending channel, around $210. If that level fails, I believe we could see further downside—potentially even a move below $200 if selling pressure intensifies.
Technical Observations:
1. **Descending Channel**
My chart shows TSLA trading within a **downward-sloping channel**. The stock is currently near the lower portion of that channel, suggesting that if it loses support at $210, it may continue sliding along the lower band.
2. **Key Support & Resistance Levels**
- $210: This level is both a psychological round number and the lower bound of the channel. If it doesn’t hold, further downside is likely.
- $232: This is a notable resistance level near the channel’s upper boundary. Breaking above $232 (especially on strong volume) could be a signal of a short-term reversal or a relief rally.
3. **Indicators (RSI & TRAMA)**
- **RSI**: Currently in oversold territory, which sometimes indicates a potential bounce. However, oversold can remain oversold if momentum is strong.
- **TRAMA** (my chosen trend/momentum indicator): Still suggests a strong downward trend. Any bounce could be short-lived unless broader conditions change.
4. **Potential Bearish Continuation vs. Bullish Breakout**
- **Bearish Continuation**: If TSLA cannot hold $210 and continues to close below that channel line, I believe a drop below $200 becomes increasingly likely.
- **Bullish Breakout**: In the unlikely event of a swift rebound above $232, it would signal a break of the channel’s upper boundary and potentially open the door to a short-term rally.
My Personal Trading Perspective:
The slight bounce might just be a short-term relief rally, where buyers step in to pick up shares at a perceived discount. However, if there’s no follow-through and volume remains lackluster, the rally can fizzle out quickly, leaving room for further declines.
- Long-Term Entry:
I’d personally look for a strong breakout and daily close above $232 (and above the upper 2nd deviation line) before adding to any long-term positions. That would give me more confidence that the downward trend is reversing.
- Short-Term Long:
I’m watching for a retest of $210. If it holds and shows signs of a bounce, I might take a short-term long position with a potential profit target around $220. I would keep a tight stop-loss, though, because if $210 fails, it could drop quickly.
My report is similar to yesterday. My thought process has not changed.
Disclaimer: This is my personal trading perspective and not formal investment advice. Always do your own research, double check my findings, and manage your risk accordingly.

TSLA 60-80 dollars -> 1400With the economic uncertainties, I could see TSLA continuing a path of consolidation to the 60-70 dollar region with a massive swing up to 1400

TSLA: What Happened?After reaching all time high of $488.50 on 18 Dec '24, Tesla has been systematically dropping making lower lows. So far it made a local low at $325.10 which is -33% from ATH.
One might intuitively assume that Tesla’s CEO, with significant administrative resources at his disposal, would drive the stock to outperform on a longer period. This narrative held true, particularly after it became evident that the Republican candidate had won the U.S. election. Traders saw Musk’s association with that political circle as a strong buy signal, believing that many others would definitely jump in as well. As a result, price broke out of the resistance driving demand and pushing the stock higher. However, this effect did not last very long as many would have expected.
WHAT HAPPENED?
Tesla was once the dominant force in the electric vehicle market, both in the United States and abroad. However, its sales are now collapsing, driven by a combination of political and technological factors — many of which are tied to Elon Musk’s increasingly unusual behavior.
The Sales Decline
Since January 2024 Tesla’s sales have plummeted, particularly in Europe. Recent figures paint a bleak picture:
Germany: 60% drop
France: 63% drop
Norway: 38% drop
Sweden: 44% drop
In the U.S., while the decline hasn’t been as drastic, Tesla’s share of the EV market is shrinking.
What’s Causing Tesla’s Troubles?
Several key factors contribute to Tesla’s struggles.
Increased Competition
Tesla’s early-mover advantage is disappearing. Established automakers like BMW, Mercedes, Hyundai and Kia, as well as newer EV startups like Rivian — now offer electric vehicles with longer range, faster charging, and more luxurious features. As a result, consumers have more choices, and Tesla is no longer the default option for EV buyers.
A Cooling EV Market
Some of the decline can be attributed to a broader slowdown in EV sales, particularly in Europe, where government subsidies have been scaled back. However, this alone does not explain Tesla’s sharp losses, especially compared to its competitors, many of whom are still seeing growth.
For what Europeans could not forgive Elon?
Musk's increasingly polarizing political stance like aligning with far-right figures or engaging with controversial accounts online — has alienated large segments of Tesla’s customer base in Europe and other liberal democracies. For a brand once associated with innovation and sustainability, Musk’s actions have tarnished Tesla’s reputation, particularly among progressive and tech-savvy buyers who once formed its core audience.
Investor Confidence is Fading
Tesla’s stock has been highly volatile, with investors growing uneasy about the company’s future. Over the past month, the stock price has declined, reflecting broader concerns about the company’s leadership and strategic direction.
The Cybertruck’s Underwhelming Launch
The Cybertruck, once hyped as a revolutionary product, has failed to live up to expectations. Instead of broad appeal, it has become a niche product, often associated with Musk’s most fervent and politically charged supporters. Rather than expanding Tesla’s customer base, the Cybertruck seems to have further divided it.
The Bigger Issue: Musk’s Brand Overshadowing Tesla
Tesla’s current crisis highlights a broader problem: when a CEO’s personal brand becomes larger than the company itself, it can have devastating consequences. Musk’s antics — once seen as part of his “genius entrepreneur” image — are now actively harming Tesla’s sales and market position.
Many people who previously invested in Tesla stock and even owned a Tesla vehicle, they've since distanced themselves, not only due to concerns over vehicle quality but also because they no longer want to be associated with Elon. And while some of Musk’s supporters claim that Tesla will be just fine, the numbers tell a different story. Sales are falling, stock prices are shaky, and confidence in the brand is slipping. The 33% drop from ATH might be just the beginning of a larger cycle of selloff.

Tesla (TSLA) Reaching a Critical Level! Will This Reversal Hold?Market Structure Overview
* TSLA has been in a downtrend channel, forming lower highs and lower lows.
* It has now entered a reversal zone, potentially signaling a short-term bottom.
Supply and Demand Zones
* Support Zone: $217 - $230 (Reversal Zone)
* Resistance Levels: $250, $270, and major resistance at $304.50.
Key Technical Observations
* Falling Wedge Pattern: The stock is testing the lower trendline support, indicating a potential breakout.
* MACD Crossover: A possible bullish crossover is forming, suggesting momentum shift.
* Stochastic RSI Oversold: TSLA is rebounding from oversold conditions, indicating potential upside.
GEX Analysis & Option Flow Insights
* IVR: 85.5 (Elevated Implied Volatility Rank)
* IVx Avg: 103.6
* Call Walls (Resistance):
* $250: Moderate resistance
* $270: Strong resistance
* $300: Major breakout level
* Put Walls (Support):
* $217: Strong support
* $200: Extreme support level
Trade Scenarios
Bullish Case (Breakout Above $250)
* Entry: Above $250
* Target 1: $270
* Target 2: $304.50
* Stop-Loss: Below $230
Bearish Case (Breakdown Below $217)
* Entry: Below $217
* Target 1: $200
* Target 2: $190
* Stop-Loss: Above $230
Final Thoughts
TSLA is currently in a high-volatility reversal zone. Watch for a breakout above $250 for confirmation of trend reversal, while a breakdown below $217 would signal further downside.
Disclaimer:
This analysis is for educational purposes only and does not constitute financial advice. Always perform your own due diligence before making trading decisions.

TESLATesla over all trend still down ,the stock might go one more lower low or previous low sweep ,then up move possible till 300 ( WAVE C.4)

TSLA RetestBull flag break out and retest? Last run it made also gave a dip to the trendline before the move up

TESLA: Oversold but correction my not be over yet.Tesla is oversold on its 1D technical outlook (RSI = 25.606, MACD = -36.970, ADX = 56.250) but the correction may not be over. The brutal bearish wave since the December 18th 2024 ATH may technicall bottom on the HL trendline, despite having breached the 0.618 Fibonacci yesterday. That is because the April 22nd 2024 bottom was also priced below the 0.618 Fib, even under the S1 Zone. In order to buy confidently again for the long term, we need to see the 1D RSI forming HL again. We expect to see TESLA within the 200 - 190 range before a rebound takes place and then our long term target would be near the HH trendline, TP = 650.
## If you like our free content follow our profile to get more daily ideas. ##
## Comments and likes are greatly appreciated. ##
