TSLA: Buy ideaOn TSLA high probability of buying after the bounce on the support line as you can see on the chart.
TL0 trade ideas

Tesla is not the best investment in the near futureMy vision for the near future. If you look at this MACD chart over a 5-year period, you can see even better that Tesla will enter a long period of decline.

TSLAIt is currently completing wave C of the flat pattern. Soon, with the completion of wave C, I also expect the start of wave 5.

TSLA Potential Bullish Bat PatternOn the daily chart, TSLA has recently fluctuated and fallen, and the bears have the upper hand. The current downside target can pay attention to the previous demand area of 246.6-255.3. After reaching it, you can pay attention to the potential bullish bat pattern, and the buying position is around 243.2.

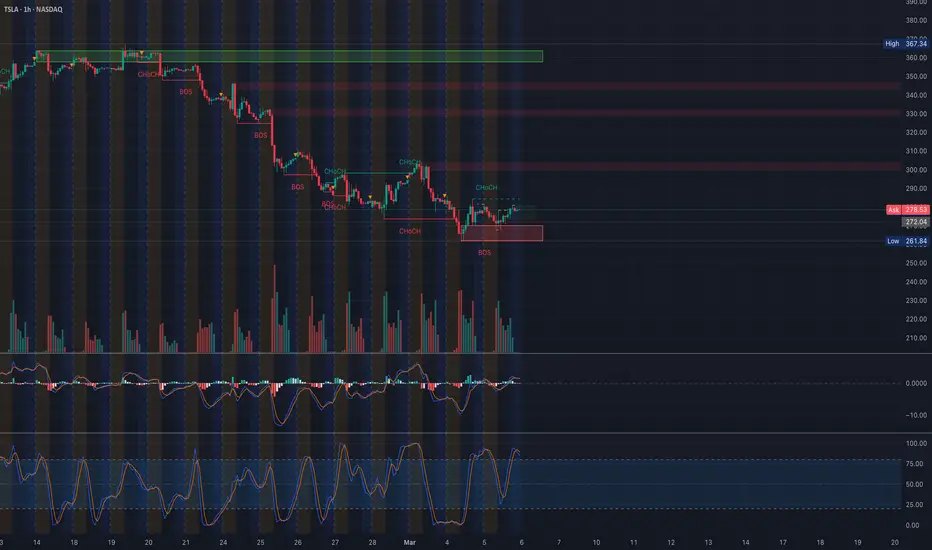
TSLA Technical Analysis – Reversal in Progress?Market Structure & Key Levels
* Current Price: $278.53
* Support: $265, $250
* Resistance: $292.5, $300, $310
TSLA has recently rebounded from a demand zone around $265, showing early signs of a potential reversal. Multiple Change of Character (ChoCH) shifts indicate a possible transition from a bearish to a bullish market structure.
Reversal Zone Analysis
TSLA has entered a potential reversal zone between $278 - $292.5. If price sustains above $278, upside momentum toward $300 and $310 could unfold. A failure to hold $278 could send it back to retest the $265 support level.
Options & GEX Analysis
* IVR: 84.1
* IVx Avg: 80.3
* GEX: Green (bullish positioning)
* Put Walls: $265, $250
* Call Walls: $292.5, $300, $310
Options flow indicates bullish sentiment, with increasing call interest above $292.5 and strong put support at $265.
Trading Plan & Strategy
Bullish Scenario (Preferred)
* Entry: Above $278 with strong volume confirmation
* Target: $292.5, then $300
* Stop-Loss: Below $272
Bearish Scenario (Less Likely)
* Entry: If price rejects the $292.5 - $300 zone
* Target: $265
* Stop-Loss: Above $295
Options Trade Idea
* Bull Call Spread: Buy $280 Calls, Sell $300 Calls (April Expiry)
* Credit Put Spread: Sell $270 Puts, Buy $260 Puts
Final Thoughts
TSLA is showing early signs of a reversal, but needs to hold above $278 for confirmation. Watch for strength toward $292.5 and $300. If price struggles at resistance, a retest of $265 is possible.
Disclaimer:
This analysis is for educational purposes only and not financial advice. Please do your own research and manage risk accordingly.
Tesla $TSLA No Bull Run until 2027? (March 5, 2025)In this video, I go over the possibility of Tesla not starting its next major bull run until January 2027

Tesla to $350: Unleashing the the C wave?"In this video, I break down MARKETSCOM:TESLA ’s short-term bullish potential. If we break above the $350 area, we could see a C-wave completion targeting the descending trendline near $380 by the end of the week. Don’t miss this trade setup

TSLAWe could see a decent bounce/retracement, but I am feeling less and less bullish on that at the moment. Looking at the fib levels and volume profile, 220 is in the cards.

TESLA Can it really reach $900?Tesla / TSLA hit its 1week MA50, having declined by -45% from its December 2024 All Time High.
This is a critical Support junction as besides the 1week MA50, the price hit both the former Falling Resistance and the Rising Support of the April 2024 low.
Last time we saw the exact same pattern was after the March 2020 COVID crash tested the 1week MA50 and rebounded.
The rebound went all the way to just over the 2.0 Fibonacci extension.
This is why we remain bullish on Tesla, targeting $900 (Fibonacci 1.5 extension).
Previous chart:
Follow us, like the idea and leave a comment below!!

$TSLA - Could bounceNASDAQ:TSLA came close to closing the gap. It is currently at the lower trendline of the channel.
I would be watching for a situation where bad news no longer impacts the price of the stock.
Currently, it is mildly oversold. A bounce could happen. 👀

Tesla at a Crossroads: $257 or a Dive to $242? Alright, Tesla fam—big decision point ahead. Do we hold $257 and drop to $242, or are we about to rip to $280 and start pushing for higher highs? Either way, something big is brewing. How are you playing this?
Kris/Mindbloome Exchange
Trader Smarter Live Better

AMZN, MSFT, META & TSLA Daily Trade SetupsIn this update we review the recent price action in Amazon, Microsoft, Meta & Tesla and identify the next high probability trading opportunities and price objectives to target. To review today's video analysis, click here!

Tesla Stock Analysis: Finding Support at $172?I stare at the chart, tracing my finger along the screen, connecting the dots—the 2020 low, the 2024 low. A rising trendline emerges, like a bridge between two cliffs, steady but not invincible.
So here we are. $172. That’s where the trendline whispers support. But is it really support, or just an illusion we want to believe in?
The Logic Behind the Line
Drawing a trendline isn’t just some artistic endeavor; it’s about psychology, repetition, and history. If enough traders see it, believe it, and act on it, then it becomes real. That’s the paradox of technical analysis. The trendline at $172? It’s not just a number—it’s where fear meets hope, where buyers might show up to defend Tesla.
But then again, what if this time is different?
Macro and Tesla-Specific Concerns
Tesla is no longer the untouchable, high-growth behemoth it once was. EV competition is intensifying, interest rates are still squeezing consumer financing, and let’s be honest—Elon’s distractions (from X to AI) don’t exactly scream "full focus on Tesla." Investors hate uncertainty, and right now, Tesla has plenty of it.
Then there's the earnings slowdown. Margins are under pressure. Price cuts have fueled demand, but at what cost? If Tesla can’t maintain its high-profit margins, the stock might deserve a lower multiple. The market isn’t rewarding growth-at-all-costs anymore—it wants efficiency, profitability, and stability.
And let’s talk about the market itself. The S&P 500 has been on a historic run, and if it corrects, Tesla—being a high-beta stock—will likely get hit harder. Tech stocks aren’t flying as they did in 2020-2021. The Fed isn’t cutting rates aggressively, at least not yet. So, does Tesla hold the line at $172, or do we see an inevitable flush lower before real buyers step in?
What’s the Play?
Alright, let’s assume Tesla does test $172. What happens then? A bounce? Sure, it could. But a strong bounce? That’s the real question. If buying pressure isn’t convincing, if volume isn’t there, then support is just a temporary floor before another leg down.
If $172 doesn’t hold, where’s the next stop? I’d be looking at $150, maybe even the psychological $140 level. That’s where things get really interesting—where long-term bulls either double down or panic sets in.
But let’s flip the script. What if Tesla does hold here? What if it bounces, regains momentum, and starts reclaiming key moving averages? Then suddenly, we’re back in play for $200, $220, maybe even beyond.
The Bottom Line
I’m watching $172 like a hawk. If it holds with conviction, I might take a shot. If it doesn’t, I’ll wait. No need to be a hero.
One thing I’ve learned in this game? The market doesn’t care about my lines. It cares about liquidity, sentiment, and the bigger picture. And right now, Tesla is at a crossroads.
Time to see which way it moves.

TeslaTimeframe: D
The price slightly missed the most probable target but showed a strong reaction at the golden ratio. I assume this asset is already in the bear market phase.
#TSLA

Bounce or Sustained Rally-Either will be Sufficient Tesla chart on weekly and daily timeframe. Bounce is likely incoming, at best a sustained rally.

Effective inefficiencyStop-Loss. This combination of words sounds like a magic spell for impatient investors. It's really challenging to watch your account get smaller and smaller. That's why people came up with this magic amulet. Go to the market, don't be afraid, just put it on. Let your profits run, but limit your losses - place a Stop-Loss order.
Its design is simple: when the paper loss reaches the amount agreed upon with you in advance, your position will be closed. The paper loss will become real. And here I have a question: “ Does this invention stop the loss? ” It seems that on the contrary - you take it with you. Then it is not a Stop-Loss, but a Take-Loss. This will be more honest, but let's continue with the classic name.
Another thing that always bothered me was that everyone has their own Stop-Loss. For example, if a company shows a loss, I can find out about it from the reports. Its meaning is the same for everyone and does not depend on those who look at it. With Stop-Loss, it's different. As many people as there are Stop-Losses. There is a lot of subjectivity in it.
For adherents of fundamental analysis, all this looks very strange. I cannot agree that I spent time researching a company, became convinced of the strength of its business, and then simply quoted a price at which I would lock in my loss. I don't think Benjamin Graham would approve either. He knew better than anyone that the market loved to show off its madness when it came to stock prices. So Stop-Loss is part of this madness?
Not quite so. There are many strategies that do not rely on fundamental analysis. They live by their own principles, where Stop-Loss plays a key role. Based on its size relative to the expected profit, these strategies can be divided into three types.
Stop-Loss is approximately equal to the expected profit size
This includes high-frequency strategies of traders who make numerous trades during the day. These can be manual or automated operations. Here we are talking about the advantages that a trader seeks to gain, thanks to modern technical means, complex calculations or simply intuition. In such strategies, it is critical to have favorable commission conditions so as not to give up all the profits to maintaining the infrastructure. The size of profit and loss per trade is approximately equal and insignificant in relation to the size of the account. The main expectation of a trader is to make more positive trades than negative ones.
Stop-Loss is several times less than the expected profit
The second type includes strategies based on technical analysis. The number of transactions here is significantly less than in the strategies of the first type. The idea is to open an interesting position that will show enough profit to cover several losses. This could be trading using chart patterns, wave analysis, candlestick analysis. You can also add buyers of classic options here.
Stop-Loss is an order of magnitude greater than the expected profit
The third type includes arbitrage strategies, selling volatility. The idea behind such strategies is to generate a constant, close to fixed, income due to statistically stable patterns or extreme price differences. But there is also a downside to the coin - a significant Stop-Loss size. If the system breaks down, the resulting loss can cover all the earned profit at once. It's like a deposit in a dodgy bank - the interest rate is great, but there's also a risk of bankruptcy.
Reflecting on these three groups, I formulated the following postulate: “ In an efficient market, the most efficient strategies will show a zero financial result with a pre-determined profit to loss ratio ”.
Let's take this postulate apart piece by piece. What does efficient market mean? It is a stock market where most participants instantly receive information about the assets in question and immediately decide to place, cancel or modify their order. In other words, in such a market, there is no lag between the appearance of information and the reaction to it. It should be said that thanks to the development of telecommunications and information technologies, modern stock markets have significantly improved their efficiency and continue to do so.
What is an effective strategy ? This is a strategy that does not bring losses.
Profit to loss ratio is the result of profitable trades divided by the result of losing trades in the chosen strategy, considering commissions.
So, according to the postulate, one can know in advance what this ratio will be for the most effective strategy in an effective market. In this case, the financial result for any such strategy will be zero.
The formula for calculating the profit to loss ratio according to the postulate:
Profit : Loss ratio = %L / (100% - %L)
Where %L is the percentage of losing trades in the strategy.
Below is a graph of the different ratios of the most efficient strategy in an efficient market.
For example, if your strategy has 60% losing trades, then with a profit to loss ratio of 1.5:1, your financial result will be zero. In this example, to start making money, you need to either reduce the percentage of losing trades (<60%) with a ratio of 1.5:1, or increase the ratio (>1.5), while maintaining the percentage of losing trades (60%). With such improvements, your point will be below the orange line - this is the inefficient market space. In this zone, it is not about your strategy becoming more efficient, you have simply found inefficiencies in the market itself.
Any point above the efficient market line is an inefficient strategy . It is the opposite of an effective strategy, meaning it results in an overall loss. Moreover, an inefficient strategy in an efficient market makes the market itself inefficient , which creates profitable opportunities for efficient strategies in an inefficient market. It sounds complicated, but these words contain an important meaning - if someone loses, then someone will definitely find.
Thus, there is an efficient market line, a zone of efficient strategies in an inefficient market, and a zone of inefficient strategies. In reality, if we mark a point on this chart at a certain time interval, we will get rather a cloud of points, which can be located anywhere and, for example, cross the efficient market line and both zones at the same time. This is due to the constant changes that occur in the market. It is an entity that evolves together with all participants. What was effective suddenly becomes ineffective and vice versa.
For this reason, I formulated another postulate: “ Any market participant strives for the effectiveness of his strategy, and the market strives for its own effectiveness, and when this is achieved, the financial result of the strategy will become zero ”.
In other words, the efficient market line has a strong gravity that, like a magnet, attracts everything that is above and below it. However, I doubt that absolute efficiency will be achieved in the near future. This requires that all market participants have equally fast access to information and respond to it effectively. Moreover, many traders and investors, including myself, have a strong interest in the market being inefficient. Just like we want gravity to be strong enough that we don't fly off into space from our couches, but gentle enough that we can visit the refrigerator. This limits or delays the transfer of information to each other.
Returning to the topic of Stop-Loss, one should pay attention to another pattern that follows from the postulates of market efficiency. Below, on the graph (red line), you can see how much the loss to profit ratio changes depending on the percentage of losing trades in the strategy.
For me, the values located on the red line are the mathematical expectation associated with the size of the loss in an effective strategy in an effective market. In other words, those who have a small percentage of losing trades in their strategy should be on guard. The potential loss in such strategies can be several times higher than the accumulated profit. In the case of strategies with a high percentage of losing trades, most of the risk has already been realized, so the potential loss relative to the profit is small.
As for my attitude towards Stop-Loss, I do not use it in my stock market investing strategy. That is, I don’t know in advance at what price I will close the position. This is because I treat buying shares as participating in a business. I cannot accept that when crazy Mr. Market knocks on my door and offers a strange price, I will immediately sell him my shares. Rather, I would ask myself, “ How efficient is the market right now and should I buy more shares at this price? ” My decision to sell should be motivated not only by the price but also by the fundamental reasons for the decline.
For me, the main criterion for closing a position is the company's profitability - a metric that is the same for everyone who looks at it. If a business stops being profitable, that's a red flag. In this case, the time the company has been in a loss-making state and the size of the losses are considered. Even a great company can have a bad quarter for one reason or another.
In my opinion, the main work with risks should take place before the company gets into the portfolio, and not after the position is opened. Often it doesn't even involve fundamental business analysis. Here are four things I'm talking about:
- Diversification. Distribution of investments among many companies.
- Gradually gaining position. Buying stocks within a range of prices, rather than at one desired price.
- Prioritization of sectors. For me, sectors of stable consumer demand always have a higher priority than others.
- No leverage.
I propose to examine the last point separately. The thing is that the broker who lends you money is absolutely right to be afraid that you won’t pay it back. For this reason, each time he calculates how much his loan is secured by your money and the current value of the shares (that is, the value that is currently on the market). Once this collateral is not enough, you will receive a so-called margin call . This is a requirement to fund an account to secure a loan. If you fail to do this, part of your position will be forcibly closed. Unfortunately, no one will listen to the excuse that this company is making a profit and the market is insane. The broker will simply give you a Stop-Loss. Therefore, leverage, by its definition, cannot be used in my investment strategy.
In conclusion of this article, I would like to say that the market, as a social phenomenon, contains a great paradox. On the one hand, we have a natural desire for it to be ineffective, on the other hand, we are all working on its effectiveness. It turns out that the income we take from the market is payment for this work. At the same time, our loss can be represented as the salary that we personally pay to other market participants for their efficiency. I don't know about you, but this understanding seems beautiful to me.

Tesla Daily Update : Fib Golden ZoneTesla’s daily chart shows a correction after a strong uptrend, with the price around the 200-day MA at $279.80. It’s now inside the "Golden Zone" (Fibonacci support between $261.48 and $218.34), a key area for potential support. The RSI at 34.39 indicates oversold conditions, suggesting selling pressure may be nearing exhaustion. Despite the recent decline, a bullish case can be made as the price approaches the "Golden Zone," a historically strong support area, combined with an oversold RSI. If TSLA holds above $261.48 and volume picks up, it could bounce back toward the 200-day MA at $279.80, offering a favorable setup for buyers.

TSLA: what you think is a bad time to invest...It's actually an opportunity. A second chance really, to get Tesla under $300. You wanted it at this price less than a year ago and you won't touch it today at the same price? And if you say a decrease in EV sales is the reason you won't, then you're lost and need to go look at technical analysis for Apple

Tesla your time now, LONG Tesla's time has come for long.. Now the price will go up... There might be little more spike down or not.. But in max 5-7 working days price will increase..
No fundamentals no technicals.. pure something else..
My posts are not trading or investment advises. Do your own analysis. I am not responsible for your losses.


$TSLA Short - Weekly TFAbout to pose the 50-Day HMA. Looks to be rolling over on multiple timeframes. Fundamentally, while nothing seems out of sorts—other than car batteries setting on fire and locking passengers inside—I think some political circumstances will change things imho.


Price target 260I believe tsla is headed to 260 that is where we have support against longterm uptrend.
nfa.
thanks
