U9R trade ideas

$UAALow risk area.
Backtest after 2nd shoulder.
IHS pattern along a strong support line.
Targets = A & C of harmonic.

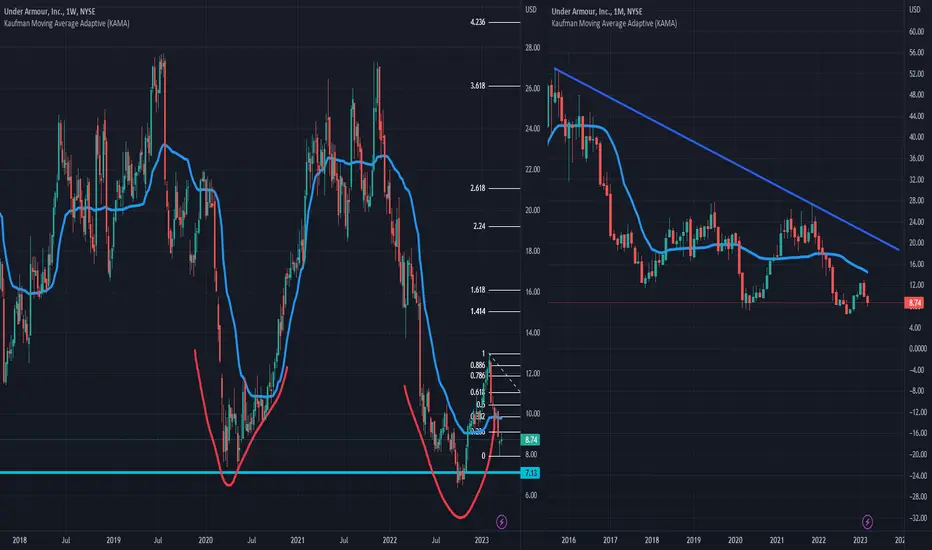
UA still an amazing pick for 2024UA completed this bullish harmonic over 8 months ago. It hit our first tp of the trade set up before falling below the key level where we were stopped out.
We do not have an open leveraged position on this asset but we are accumulating it at these levels as it has turned bullish again.
The spring back above the key level and the backtest that has occurred indicate that it is ready to go. Above 6.5 it is bullish, we are creating bullish divergence also.

UAA Under Armour Options Ahead of EarningsAnalyzing the options chain and the chart patterns of UAA Under Armour prior to the earnings report this week,
I would consider purchasing the 7usd strike price Calls with
an expiration date of 2023-11-10,
for a premium of approximately $0.59.
If these options prove to be profitable prior to the earnings release, I would sell at least half of them.
Looking forward to read your opinion about it.

(NYSE: UAA) Under Armors' Revenue is Under Pressure Under Armour Inc (NYSE:UA) shares rose after the sportswear maker reported second-quarter earnings that exceeded analysts’ expectations, as well as its own.
However, while it maintained its outlook for full-year earnings, it lowered its revenue expectations due to challenges in North America, its biggest market, during the back half of the year.
For the three months to September 30, 2023, the company posted flat revenue of $1.6 billion as revenue increases in EMEA and the Asia Pacific region made up for declines in North America and Latin America.
Revenue from apparel and accessories rose, compensating for a decline in footwear revenue. Diluted earnings per share (EPS) rose 26% to $0.24.
The company has guided for full-year 2024 revenue to be 2% to 4% down versus its previous expectation of flight to slightly higher.
However, it expects a gross margin of 100 to 125 basis points against its previous guidance of 25 to 75 basis points.
It still expects to achieve diluted EPS of between $0.47 and $0.51.
Technical Analysis
UAA is trading near the bottom of its 52-week range and below its 200-day simple moving average.
What does this mean?
Investors have been pushing the share price lower, and the stock still appears to have downward momentum as you can see depicted on the trendline.

Under Armour has posted a double bottom.Under Armour Inc - 30d expiry - We look to Buy at 7.05 (stop at 6.71)
Posted a Double Bottom formation.
6.97 has been pivotal.
7.00 continues to hold back the bears.
Bespoke support is located at 7.00.
Dips continue to attract buyers.
We expect prices to stall close to our bespoke level (7.00).
Our profit targets will be 7.90 and 8.10
Resistance: 7.65 / 7.88 / 8.00
Support: 7.36 / 7.20 / 7.00
Please be advised that the in formation presented on TradingView is provided to Vantage (‘Vantage Global Limited’, ‘we’) by a third-party provider (‘Everest Fortune Group’). Please be reminded that you are solely responsible for the trading decisions on your account. There is a very high degree of risk involved in trading. Any information and/or content is intended entirely for research, educational and informational purposes only and does not constitute investment or consultation advice or investment strategy. The information is not tailored to the investment needs of any specific person and therefore does not involve a consideration of any of the investment objectives, financial situation or needs of any viewer that may receive it. Kindly also note that past performance is not a reliable indicator of future results. Actual results may differ materially from those anticipated in forward-looking or past performance statements. We assume no liability as to the accuracy or completeness of any of the information and/or content provided herein and the Company cannot be held responsible for any omission, mistake nor for any loss or damage including without limitation to any loss of profit which may arise from reliance on any information supplied by Everest Fortune Group

Potential higher prices for Under ArmourPrice action is showing a potential market structure shift to the upside. At a nice level to take buys from considering the price action. One of my personal favorites on my watchlist due to the price action setup on multiple time frames.


UA Under Armour Options Ahead of EarningsAnalyzing the options chain and the chart patterns of UA Under Armour prior to the earnings report this week,
I would consider purchasing the 10usd strike price Calls with
an expiration date of 2024-1-19,
for a premium of approximately $0.27.
If these options prove to be profitable prior to the earnings release, I would sell at least half of them.
Looking forward to read your opinion about it.

Bullish Alert : UAA15 minutes
After a lower low, the price is now moving to fill the gap at 7.87
This scenario will see a bullish crossover with positive price action.

UAA Long Term Investment to New All Time High UAA has a buy range between $6.40 and $8.
We caught this UAA long in the early stages of a breakout around $7.50.
Target Prices
TP 1
$14 is the first price target
TP 2
White resistance line (tough to accurately forecast, I will update this target later).
TP 3
$22 is the third price target
TP 4
$51.77 is the fourth price target then UAA can find price discovery to form a new all time high.

BEST STOCK PICK MEDIUM AND LONG TERMUA has the best possible set up you could ask for. I am in this from the entry point on the trade and will add if this support holds... I know I should've posted it earlier.
A double bottom at a critical level completing the typr two return of the bullish cypher. Along with this showing bullish divergence. On top of this the weekly looks AMAZING .
It might take a while to play out but you can't ask for a better set up.

Scam It...Chart looks like it's bottomed and we're starting the scamage higher - no idea what the company fundamentals look like but their clothing is comfy lol.

HUGE UPSIDE POTENTIALBeautiful setup.
-Class A bullish Div on both oscillators
-Backtesting and holding an ice line support after a false breakdown
-daily hammer candle off support
Easy R:R
Best of luck!

UA Stock analysisI will be buying UA and will target 22 level and may leave part open if it goes up more than that

UAA // double bottom formationA double bottom formation is seen on the chart at the level of 7.13. As long as the prices remain above 7.13, the transaction can be entered or let's look for closings above the wedge indicator in the weekly time frame. Pay attention to the wedge resistance in the monthly time frame.
$UAA blinking me an eyeI sold my position at the top of the channel, but now the downtrend should be complete, everything is consolidating.

Month Long OportunityNYSE:UAA is showing so really strength in it's financials and backing this up, technical analysis is showing investors are confident in the growth for this quarter. It has been showing a steady and supported growth which all signals indicate will continue.
A Buy Long position entry is coming up soon at a supported price of around 11 with a good Sell Out opening at around 14.7 !

UAA has a lot of upside potential $UAANYSE:UAA
Taking a look at under armor here. Here's a ticker I completely forgot about last year lol
Looking at it here though it may be time to put this one on your watch list
could potentially double in value in the coming year.
Really like the look of this chart as a long term hold.
No trade set up since its sort of pulled away from an entry level but even still, this chart screams upside.
what's everyone's thought on UAA?
Happy Trading

*UA- POSSIBLE ST BUll TREND*
NYSE:UA
"Our preference: “Neutral" on the trend and pivot point, pending market driven data. Alpha1's favored outcome illustrated by the directional arrow(s) on the chart image.
A comment that briefly describes the arguments underlying the strategy and how Alpha1 formed its opinion.
o Bullish – Trading Opportunities:
The pair has been trending upward on the daily chart.
Price is making higher highs and higher lows.
Price crossed above the SMA 200 in early January 2023.
Price breached Resistance #1.
Next test will be Resistance #2.
• Factors affecting next move - Depending on macroeconomic events, earnings*, other fundamental data
*Earnings Release – Wednesday, March 23, 2023, Est. 0.088.
o Bearish – Trading Opportunities:
Next test will be Resistance #2. If earnings miss this will not be a good bullish sign, so look for short trading opportunities.
• Factors affecting next move - Depending on macroeconomic events, earnings*, other fundamental data
*Earnings Release – Wednesday, March 23, 2023, Est. 0.088.
The ST and MT trend summarizes Alpha1’s opinion and is Short Term (ST) over one week horizon or the Medium Term (MT) over one month horizon.
o Short Term – A1’s opinion within two weeks- Bullish
o Medium Term - A1’s opinion within one month - Neutral


UAA head and shoulder formationAfter dubbeltop formation and deep corrections we now see an clearly head and shoulder formation, if it holds (12 dollar) i think we can have a nice uptrend for UAA (bullish)

UAA Daily ViewHello and welcome to my opinion about UAA.
If we take a look at chart we cand see we are near to 200 EMA. If we brake this EMA and retest, it probably to reach 16.10.
If we just test EMA 200 it probably to go deeper at 5.01.
See u next time and take care of your plan.
