UPAB trade ideas

UPS LONGTrading at key support level. Watch for a bounce and pull back to the inverse fair value gap for long entry. Consecutive closing below support- close position!
PS- Not financial advice. Do your own due diligence.

UPS ready for a 20% moveUnited Parcel Service Inc. (UPS) having previously closed below key support, showing potential weakness.
However, there is significant support below present price levels.
Holding above secondary support, (UPS) is susceptible to recovery over the months ahead.
A weekly settlement above near-term resistance would place (UPS) in a buy signal where gains of 20% would be expected over the next 3 - 5 months.
Inversely, closing below support would elicit a sell signal where losses of 20% would be expected over the same time horizon.

UPS has some, uh, GAPSI was looking into UPS as a possible investment, and wanted to get a price, but after looking at the chart, I'm not sure it's worth it. There seems to be a lot of potential downside, including a pretty sizeable gap around $120.
With almost everyone telling me the market is going to crash, I'm thinking we won't see it crash just yet, which does allow for some return in UPS's price to around $223-$225. The question, does it bounce there or keep going? I'm not sure, which is why I'll wait for confirmation of price action, but it's looking like UPS needs to cool off a bit. The move to $108 would be around a 45%-50% drop, which really isn't out of the question as it brings us back to pre-covid levels, when the shipping craze started.
Thoughts?

Down Weeks Ahead for UPSWeekly chart of UPS
UPS in the third impulse wave of its Corrective Wave (red coloured wave). However, we are only half-way into the third impulse corrective wave.
UPS had a support at 155 level, which it lost yesterday.
UPS is below 50 and 200 SMAs.
During the third impulse wave of the Motive Wave (green coloured wave), UPS made a large gap from 125 to 135. There is a support just below this region. That's where UPS is likely to stop its current downtrend.

UPSIt's crazy how a few candles can completely change the look of a chart. Just a reminder to always keep an open mind. This chart had great potential but now looks horrible imo. Head & shoulders neckline is $155. I have a target of $80 if it breaks which would put price right around the c0vid lows.

UPS long 📈Overall the metrics are looking bearish in this chart but the formation which we're forming could be identified as double-bottom.
If the FED isn't sending the stockmarket in the basement, I stay bullish in this stock.

UPS Stock Chart Fibonacci Analysis 091323 Trading Idea
1) Find a FIBO slingshot
2) Check FIBO 61.80% level
3) Entry Point > 162/61.80%
Chart time frame : C
A) 15 min(1W-3M)
B) 1 hr(3M-6M)
C) 4 hr(6M-1year)
D) 1 day(1-3years)
Stock progress : B
A) Keep rising over 61.80% resistance
B) 61.80% resistance
C) Hit the bottom
D) Hit the top
Stocks rise as they rise from support and fall from resistance. Our goal is to find a low support point and enter. It can be referred to as buying at the pullback point. The pullback point can be found with a Fibonacci extension of 61.80%. This is a step to find entry level. 1) Find a triangle (Fibonacci Speed Fan Line) that connects the high (resistance) and low (support) points of the stock in progress, where it is continuously expressed as a Slingshot, 2) and create a Fibonacci extension level for the first rising wave from the start point of slingshot pattern.
When the current price goes over 61.80% level , that can be a good entry point, especially if the SMA 100 and 200 curves are gathered together at 61.80%, it is a very good entry point.
As a great help, tradingview provide these Fibonacci speed fan lines and extension levels with ease. So if you use the Fibonacci fan line, the extension level, and the SMA 100/200 curve well, you can find an entry point for the stock market. At least you have to enter at this low point to avoid trading failure, and if you are skilled at entering this low point, with fibonacci6180 technique, your reading skill to chart will be greatly improved.
If you want to do day trading, please set the time frame to 5 minutes or 15 minutes, and you will see many of the low point of rising stocks.
If want to prefer long term range trading, you can set the time frame to 1 hr or 1 day.

UPS LongNYSE:UPS
Will UPS stop the free fall ?
Looking for Price Action for long,
Stop at 150 or maybe add

UPS Confirms Lower High Bearish Consolidation Below Demand LineThe UPS price action has confirmed a Lower High Bearish Consolidation Structure below the macro Demand Line has basically done so via a secondary Head and Shoulders with PPO Confirmation thereby confirming a Bearish BAMM that will likely take us down to the 88.6% retrace at $90

What's happening with UPS? AnalysisLabor Relations and Employee Concerns:
A recent article by UPS employee and bargaining committee member, Jill Dunson in Newsweek, discusses the UPS contract.
Many workers have issues with the contract, specifically over starting wages, wage hikes, working conditions, and pension contributions.
UPS has settled with the International Brotherhood of Teamsters, representing approximately 330,000 workers.
Some part-time employees have expressed discontent with the new agreement.
Steps have been taken by UPS to prevent strike effects, which includes training non-union delivery personnel.
By January 2024, UPS plans to implement better working conditions by equipping delivery vehicles with air conditioning and other safety features.
Amazon's Impact on UPS and FedEx:
Amazon is restarting a third-party logistics effort, causing nervousness among investors in logistics stocks.
Amazon plans to roll out more than 300 electric delivery vehicles in Germany and aims to have 100,000 on the road globally by 2030.
Amazon's logistics program poses competition for UPS and FedEx, leading to a decline in their shares.
Some analysts suggest that Amazon could become a shipping giant by acquiring FedEx.
Increased shipping rates imposed by UPS and FedEx have caused concern, and Amazon may believe it can perform more efficiently or less expensively.
FedEx CEO, Raj Subramaniam, believes that Amazon's attempt to compete directly will be difficult.
Price action:
UPS stock price is hovering near the support range of $165 and showed a breakdown of the rising wedge pattern.
The stock is trading in a narrow congestion range due to negative sentiment from mixed Q2 earnings results.
Multiple bearish patterns have formed, with the stock slipping below the 38.2% Fib level and lower Bollinger band.
The RSI is in the oversold region, showing bearish divergence.
The MACD indicator formed a bearish crossover and red bars on the Histogram.
The stock closed below the trendline of $170, and support levels are at $160 and $150, while resistance levels are at $180 and $190.
Analysts maintain a neutral rating with a yearly target price of $191.54.

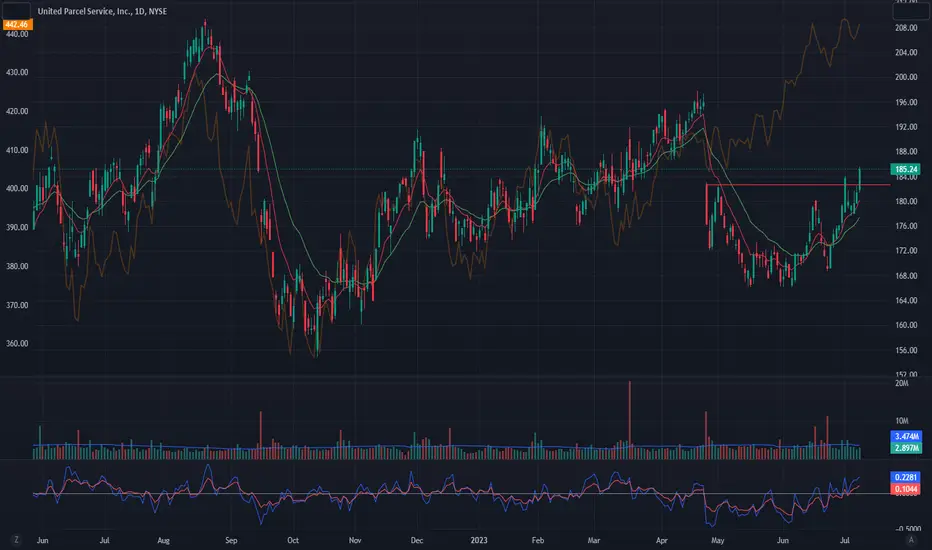
UPSSell of since last earnings here.
Landed on weekly trendline support along with weekly 200sma which it hasn't broken since covid 2020.
Money flow went oversold here also.
Looking for a bounce back to resistance at 190.
My first target for taking profit is 180 or daily 200sma

UPS United Parcel Service Options Ahead of EarningsAnalyzing the options chain and the chart patterns of UPS United Parcel Service prior to the earnings report this week,
I would consider purchasing the 170usd strike price Puts with
an expiration date of 2024-1-19,
for a premium of approximately $7.35.
If these options prove to be profitable prior to the earnings release, I would sell at least half of them.
Looking forward to read your opinion about it.

United Parcel Service Inc.(‘UPS’) share price has lost almost 10United Parcel Service Inc. (symbol ‘UPS’) share price has lost almost 10% of its valuation in the second quarter of 2023. The company’s earnings report for the fiscal quarter ending June 2023 is set to be released on Tuesday 8th of August, before market open. The consensus EPS is $2.51 compared to the same quarter of last year at $3.29.
‘The company has a relatively consistent dividend yield of more than 3% where in combination with the payout ratio of around 50% makes it an attractive addition to investors' portfolios.’ said Antreas Themistokleous at Exness.
From the technical analysis perspective the price is trading in an ascending channel for the last month while it is currently testing the technical resistance area of the gap formed in late April. If the price manages to break below the 61.8% of the Fibonacci retracement level then the next level of support could possibly be found around the $182 price area which consists of the 50% of the Fibonacci as well as the 100 day moving average.
The RSI indicator retraced from its extreme upper limit of 70 but its still above the 50 line so we cannot gauge with certainty the short term direction of the price based on this. One of the factors that will be affecting the directional movement of the price will most certainly be the earnings report on the 8th.

UPS - Moves into gapThis is the second attempt for UPS to move into the 4/25/23 FGD and while volume is weak it is showing price strength and now a higher high.
Nice RR here of about $2.50:$10.
UPS-BEARISH SCENARIOLast month, a significant majority of 97% of UPS Teamsters voted in favor of authorizing a strike in the event that the parcel delivery company fails to present a satisfactory contract for the workers. National negotiations between the Teamsters and UPS commenced on April 17.
In the US parcel shipping market, UPS holds a market share of 24% based on parcel volume as of 2022. It is the second-largest player in the market, trailing only behind the US Postal Service, which holds a 32% market share.
The potential strike has the potential to further impact the already underwhelming financial performance of UPS. In the first quarter of 2023, the company reported an operating profit of $2.5 billion, representing a decline of 21.8% compared to the same period in the previous year. The reduced volume can be attributed to a slowdown in US retail sales and weakened demand in Asia.
Risk Disclosure: Trading Foreign Exchange (Forex) and Contracts of Difference (CFD's) carries a high level of risk. By registering and signing up, any client affirms their understanding of their own personal accountability for all transactions performed within their account and recognizes the risks associated with trading on such markets and on such sites. Furthermore, one understands that the company carries zero influence over transactions, markets, and trading signals, therefore, cannot be held liable nor guarantee any profits or losses.

UPS Weekly PutBuy NYSE:UPS Jul-07-23 $172.5 Strike Puts @ 0.14 Limit to Open
A quick short due in 3 days. Cheap entry with huge gain if the volatile drop continues to the downside.

UPS more upsideUPS looks pretty good.
The higher low seems to be confirmed and UPS may be ready for a mark-up phase .
Expecting a strong move in the next weeks.
Entry, stop loss and 2 targets (red lines) are shown on the chart.
Risk - reward ratio : 2,72
Good luck

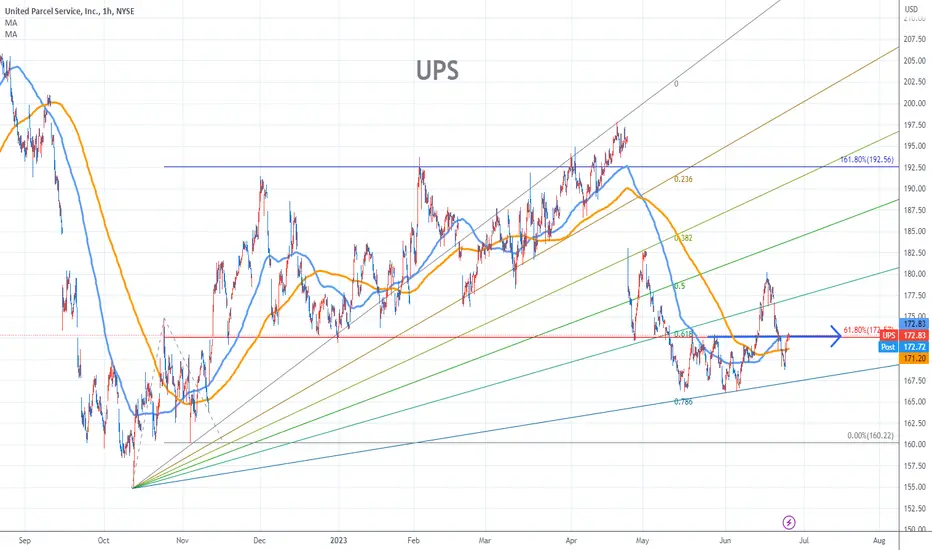
UPS Stock Chart Fibonacci Analysis 062623 Trading Idea
1) Find a FIBO slingshot
2) Check FIBO 61.80% level
3) Entry Point > 173/61.80%
Chart time frame : B
A) 15 min(1W-3M)
B) 1 hr(3M-6M)
C) 4 hr(6M-1year)
D) 1 day(1-3years)
Stock progress : B
A) Keep rising over 61.80% resistance
B) 61.80% resistance
C) Hit the bottom
D) Hit the top
Stocks rise as they rise from support and fall from resistance. Our goal is to find a low support point and enter. It can be referred to as buying at the pullback point. The pullback point can be found with a Fibonacci extension of 61.80%. This is a step to find entry level. 1) Find a triangle (Fibonacci Speed Fan Line) that connects the high (resistance) and low (support) points of the stock in progress, where it is continuously expressed as a Slingshot, 2) and create a Fibonacci extension level for the first rising wave from the start point of slingshot pattern.
When the current price goes over 61.80% level , that can be a good entry point, especially if the SMA 100 and 200 curves are gathered together at 61.80%, it is a very good entry point.
As a great help, tradingview provide these Fibonacci speed fan lines and extension levels with ease. So if you use the Fibonacci fan line, the extension level, and the SMA 100/200 curve well, you can find an entry point for the stock market. At least you have to enter at this low point to avoid trading failure, and if you are skilled at entering this low point, with fibonacci6180 technique, your reading skill to chart will be greatly improved.
If you want to do day trading, please set the time frame to 5 minutes or 15 minutes, and you will see many of the low point of rising stocks.
If want to prefer long term range trading, you can set the time frame to 1 hr or 1 day.
UPS Maco This is my UPS Chart Fib Timed and Fib level with a wedge focus run up and a ellipse accumulation zone focus

UPSSetting this Macro Potential play till AUG 3 I will be looking at what happens till June 29 if we run up till then, then I will be lookin at July 17 Opportunities to catch the next trend. Trying to see if this Diamond Double Curve Setup will play out to the run up potential to 193-195 at the end of this pattern frame. The spike up could come initially so thats something to watch for then a long down drip. THis is my notes not financial advice but if you do like my thoughts drop your boy a boost and cheers. 1LoV3

UPS taking profitsNYSE:UPS is up 2% today. It has hit my expected resistance so I have decided to take profits.
As shown in the 3-day chart, we have good momentum to the upside but the volume oscillator is trending down.
Note this is not bearish by any means, it only suggests that price action may be capped in the near term.
The 3 day chart is presented here based on my own back testing. I have observed that the 1 and 3 day volume tend to give more reliable predictions on trend continuations or reversals.

