WDC trade ideas


WDCBroke out of resistance zone and looks to be holding support. Might be the start of a new trend. We will see

Breakout - Western Digital - Long term Bulltrend$WDC just broke the resistance line at $51.56. This is the third time over the past 2 years.
My target is $76 - 40% gain in January 2021.
Entry: $52 , Stop loss: $46,18 at 13 days EMA.
The chart never lies. The trend is your friend until It ends.
#WDC #WesternDigital #BullTrend

WDC - Possible Pullback, Short Term Put GambleI'm a bit scared to make this play, because if this thing breaks out, I lose.
But a backtest is possible, and it might even break the slant support trend line.
Hopefully it pulls back tomorrow, so I sell and leave.
I have a 12/11 $48 put, break even 47.05.

#WDC Looking for support to retest 48.15#WDC Looking for support to retest 48.15
These are a few of the critical points im looking at for #WDC to retest at 48.15
Not sure if we will find support on that longer term trend line, but i would expect new support to be found at the circled area where we have multiple ideas colliding.
Id likely stop out to reenter below 45.97
The 46.56 area should help with support
If we fall out id look for a reentry around 44.47
or possibly further down near 43.20 and the intersection of the bottom of the paralell channel if it were to trend that far.


Western Digital wait for flat finish at 47Montlhy
Flat in downtrend and consolidation
Weekly
Flat, seems correlated with GOLD
Daily
Flat, probably consolidation
Do not see clear signs of Uptrend formation.
Also due to bad Earnings all year.
Buy only from 47$

WDC - Possibility of Strong Reversal and UptrendEqual Volume, Equal RSI, Abrupt Directional Change, (Marabozu Candle).
Possibility of 4 month uptrend.
If price goes below lower support (34), then idea invalidated.

WDC Long at DemandAfter Wedge Breakout;
Down into demand.
Entry 38
Stop 36
Target1 46
reward:risk=4:1
Earning date 10/28
I am not a PRO trader. I need few months to practice trading strategies.
If you like this idea, please use SIM/Demo account to try it, until my trading plans get high winning rate.

WDC Bullish Into EarningsMy Notes are on the Chart. There is a GAP on the WDC Daily chart up to $44+ which needs to be filled and with it breaking out of a downtrend (Support on the 38.2 Fib), i am completely BULLISH on WDC. any good news + Guidance will see them hit $45 on or before Friday so i will suggest a 10/30 $45 Strike and if you must hedge, go with a $36 Put. Open Interests are Mad there for both. Plus,. it is super cheap. These are my Yolo (Possible 400%+ plays).
For safety, play the 10/30 $42 Call and if you wish to Hedge, then use a $38.5 Put (Possible 100%+ Plays).

WDC 10-22-20 Swing ideaWDC is breaking a monthly range at 41,12, and it has been accepting above this price during last two weeks, i am watching to get long at 41,12 to look for 45,12, this company has report on OCT 28 and the high open interest are between 41 -45 for that reason i am targeting 45 zone


WDC, MACD Histogram just turned positiveThis is a Bullish indicator signaling WDC's price could rise from here. Traders may explore going long the stock or buying call options. Tickeron A.I. dvisor identified 42 similar cases where WDC's MACD histogram became positive, and 33 of them led to successful outcomes. Odds of Success: 79%. Current price $38.21 crossed the support line at $38.44 and is trading between $38.44 support and $37.84 resistance lines. Throughout the month of 09/08/20 - 10/08/20, the price experienced a +6% Uptrend. During the week of 10/01/20 - 10/08/20, the stock enjoyed a +7% Uptrend growth.
Bullish Trend Analysis
The RSI Oscillator points to a transition from a downward trend to an upward trend -- in cases where WDC's RSI Oscillator exited the oversold zone, 20 of 30 resulted in an increase in price. Tickeron's analysis proposes that the odds of a continued upward trend are 67%.
The Momentum Indicator moved above the 0 level on October 08, 2020. You may want to consider a long position or call options on WDC as a result. Tickeron A.I. detected that in 61 of 86 past instances where the momentum indicator moved above 0, the stock continued to climb. The odds of a continued upward trend are 71%.
The Moving Average Convergence Divergence (MACD) for WDC just turned positive on October 08, 2020. Looking at past instances where WDC's MACD turned positive, the stock continued to rise, Tickeron A.I. shows that in 33 of 42 cases over the following month. The odds of a continued upward trend are 79%.
WDC moved above its 50-day Moving Average on October 08, 2020 date and that indicates a change from a downward trend to an upward trend.
Following a +6.73% 3-day Advance, the price is estimated to grow further. Considering data from situations where WDC advanced for three days, Tickeron A.I. shows that in 229 of 318 cases, the price rose further within the following month. The odds of a continued upward trend are 72%.
The Aroon Indicator entered an Uptrend today. Tickeron A.I. shows that in 162 of 229 cases where WDC Aroon's Indicator entered an Uptrend, the price rose further within the following month. The odds of a continued Uptrend are 71%.


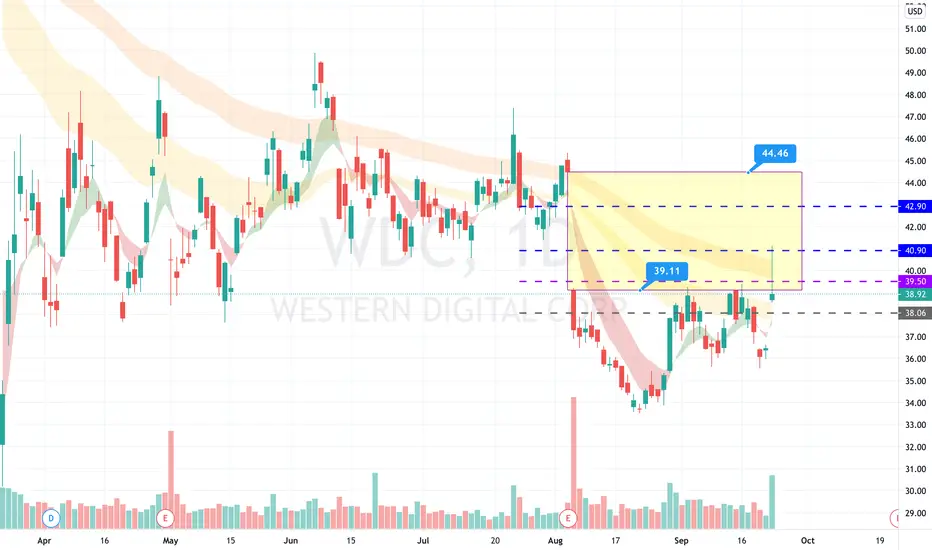
$WDC Swing Trade Setup in Western Digital
WDC once again found resistance @ $39.00 but seems to
be building some momentum.
Alert is set for $39.60 with a large 10% gap fill above.
Much may depend on MU earnings after the close on Tuesday.

Large gap to fill above, unusual options activityCame up on the unusual options activity scanner and its easy to see why. From the long upper shadow of the candle you can see it tried to move thru the gap but likely followed the market and retreated. Given enough time, over a few sessions and some upward momentum in the market, this may fill to the upside.
$WDC Gap Fill trade In Western Digital
Potential Long entry on break above the 50ma.
upgrade to buy today.
Major gap fill potential in a stock which has underperformed
hugely since the market lows in March, 45% off its highs.

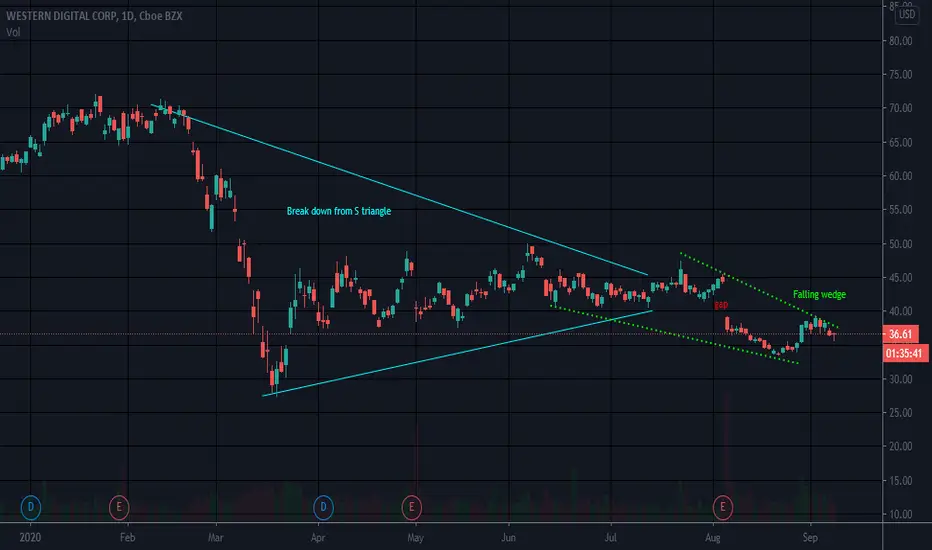
Falling Wedge Bottom FishingWDC had a break down from the S Triangle.
Seems to have formed a bottom at 33ish but yearly low is 27.4
A lot of R overhead starting with recent gap down
Not a recommendation
WDC, Technical reversal from low RSII really like low rsi plays but usually prefer to see stocks with low RSI undergo some consolidation before a move up , but we may not get that with WDC. So, that being said watch this closely if you enter .
Technicals look good with recent buying volume a nice reversal swing on the RSI . Took a position.
Target price is based on fib 0.618 level but is not set in stone.
Put call ratio 0.83 , looks good as well .
Good luck ~

WDC ForecastThis is a forecast about Western Digital Corporation.
Soon I will update this, and aim for a higher TP.
Always open for feedback.

$WDC - Potential long entry above resistance "Area of Hope" Look at the chart to understand the area
Not for any advise
Just an Idea,
