WF5A trade ideas

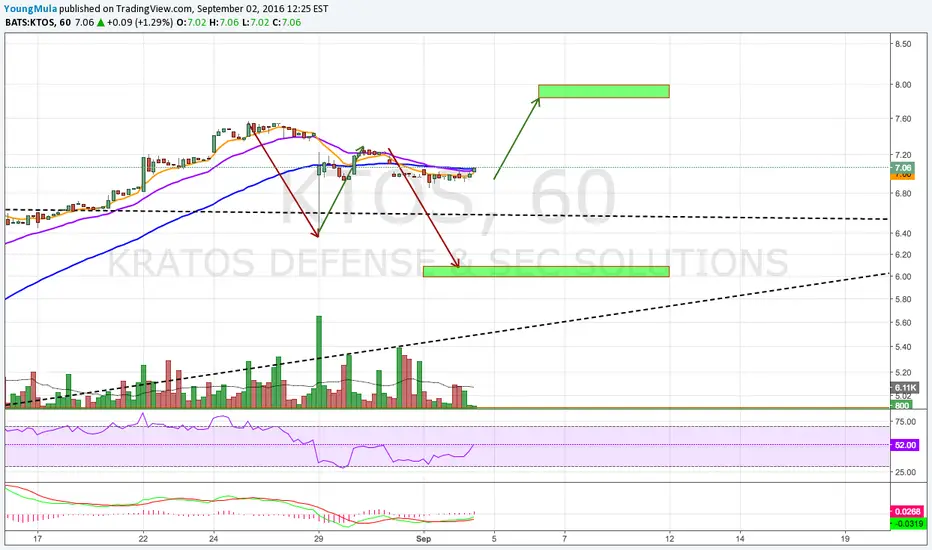
$KTOS Slumps Big after Downgrade. Great entry spot for longsAfter months of bullish activity $KTOS was downgraded to HOLD last week shares slumped % 7 below $12.00 Now a great opportunity for a long position for cheaper share price has formed. The company is thriving in drone and defense production and security, looking to post a solid earnings report.


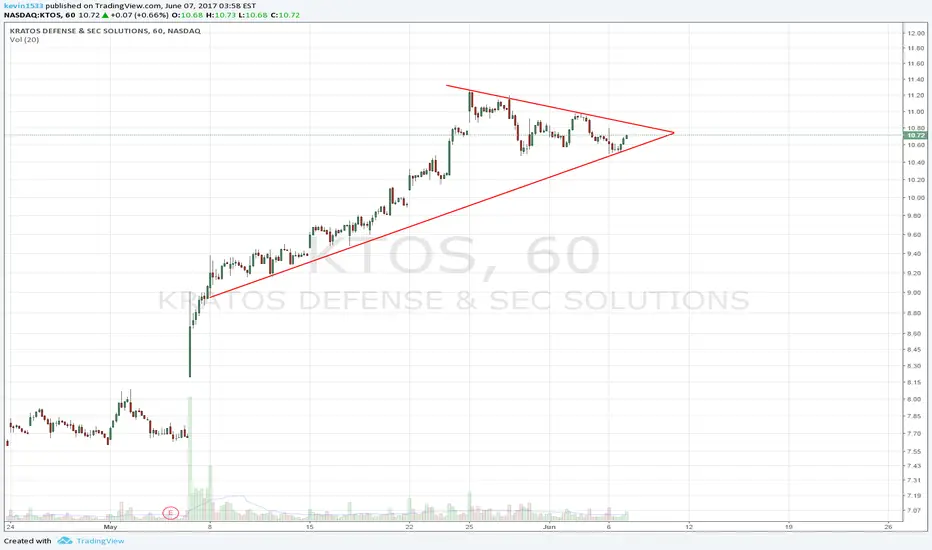

KTOS- Flag formation Momentum Long from $9.52 to $10.43 & higherKTOS seems forming a flag formation. It also broke above long term resistance & holding above quite nicely. We would take flag break to reach first target & 2nd target would be momentum.
* Trade Criteria *
Date First Found- May 11, 2017
Pattern/Why- Flag formation
Entry Target Criteria- Break of $9.52
Exit Target Criteria- $10.43
Stop Loss Criteria- $9.07
Please check back for Trade updates. (Note: Trade update is little delayed here.)


Insider buying and bullish chart CARANO BANDEL L Director Mar 07 Buy 7.25 275,862 2,000,000 13,540,305 Mar 08 10:00 AM

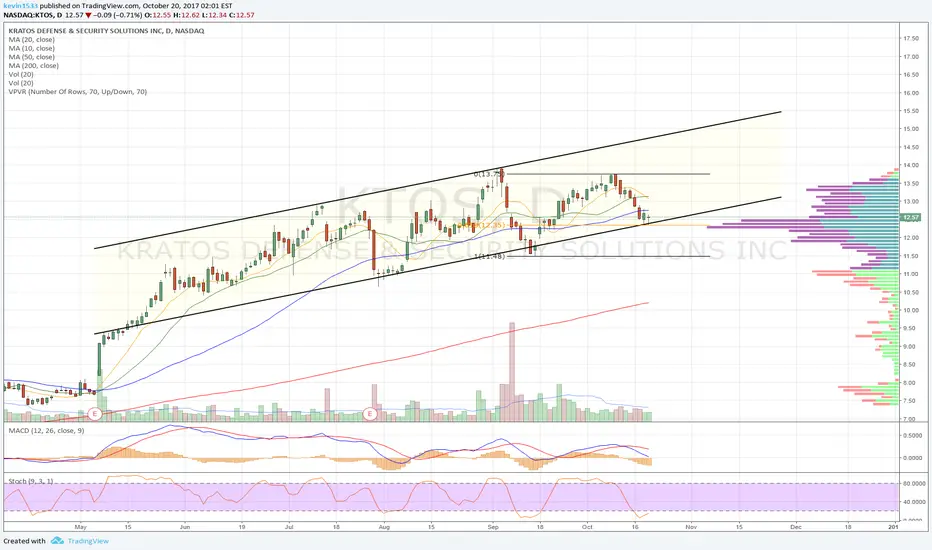
$KTOS can make strong move to the upside.Looking at chart, we could see a confluence of factors coming together. $KTOS is moving back into the value range (blue lines). It is set to break 20 and 50 MA and has seen an increase of volume over the last few days. The middle line show the control value or the value that price action has been gravitating towards over the past few months (yellow circles). Yellow arrows shows support and resistance of the value area.

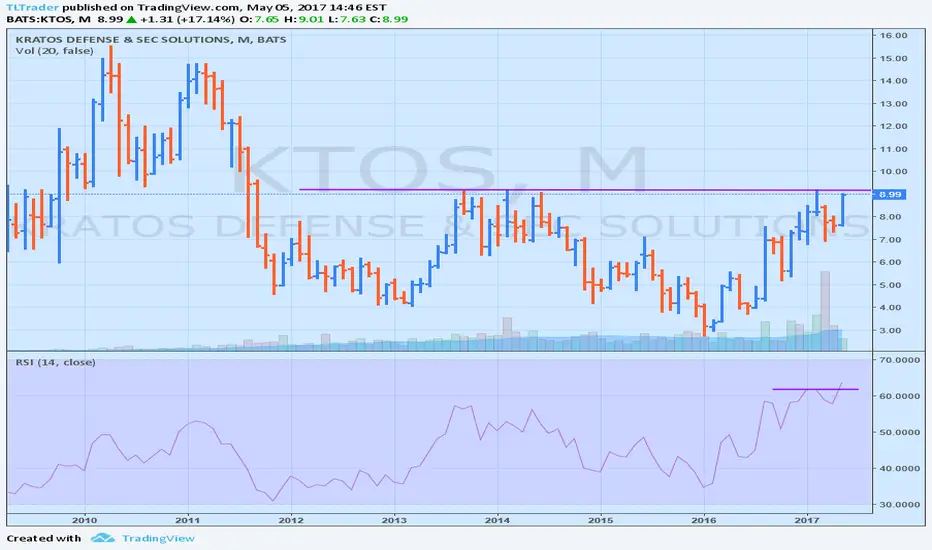
$KTOS Best Value Buy Opportunity PotentialKTOS has gotten a lot of attention on television lately, but we don't think it's buy at the moment. Fundamentally, the company's exposure in Unmanned systems as well as Directed Energy makes them a contender long-term, as these are the two fastest growing subsectors within future defense capabilities. The latest news exposure and positive earnings news last quarter blew the stock up, but we maintain the opinion that major profit taking on a relatively risky stock will drive the price downward in the short term and allow for a buy opportunity for a long term hold.


KTOS flag breaksimilar pattern as $LAZ on this one.. breaking out of the flag formation. Look for continuation of the trend