WMT trade ideas

Needs to Break $143If WMT breaks $143 we could see it enter an uptrend to the top of the trend channel

WALMART OUTLOOKThe chart looks extremely annoying, having lots of small candlesticks (->no Momentum=no trend).
I would recommend to watch for high volume plays.
As always I draw my expectation on how the stock could move in the future.


WMT for a great long playWMT doesn't give AF if the fed is talking about inflation. WMT doesn't care about infrastructure deals. WMT looks at the COVID crash and laughs it off, respecting its own trend line... Sure, you would play the weekly and monthly contracts on the small jitter, but WMT is a great example of the slow, methodical, and deliberate climb up. This is a prime candidate for a LEAP or even running a PMCC.
This is not financial advice. I just look at squiggles and fit lines to them.

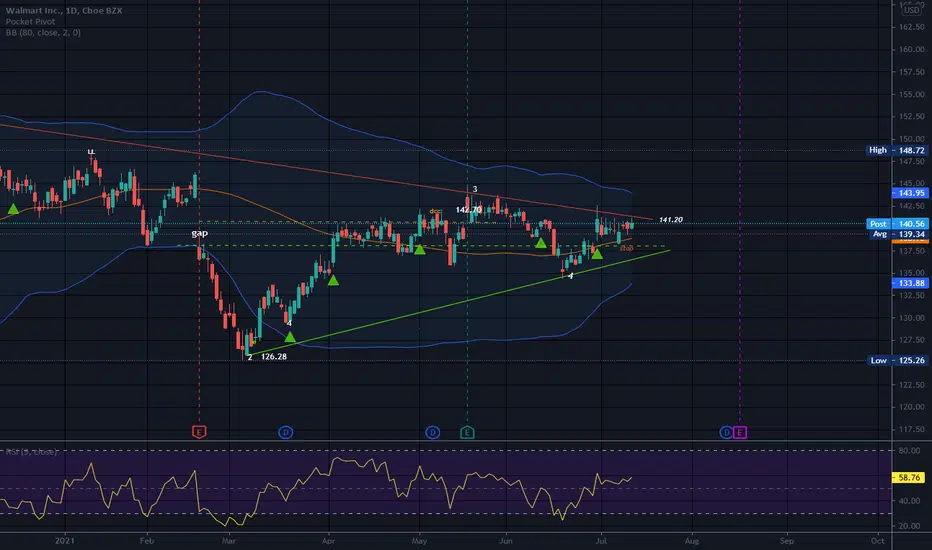
Symmetrical TriangleThis pattern is neutral until a trendline has been broken with conviction.
Possible stop under bottom trendline or somewhere you see support inside the triangle.
WMT has been in consolidation mode for quite some time. Also filled a gap.
No recommendation
$WMT Chart IdeaThe breakout to the upside of desc. triangle is a healthy setup for a bullish trend channel. We will probably see some dancing around in here if we are lucky... that would mean more day plays.

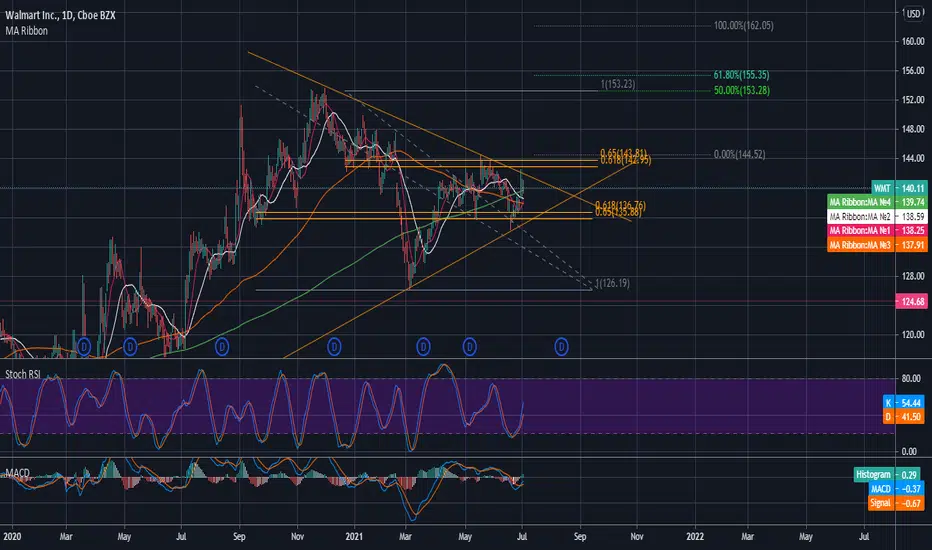
$WMT Descending Triangle Breakout IdeasBeen watching for the past week, getting closer to a move now so I thought I'd publish a chart. Obviously a great stock, my leading theory is we will see a double top sending it back to support before the final leg up/breakout.

Walmart Breakout? Theory: If candle with arrow on MACD closes green (1:30pm EST would be candle close), this may suggust a new wave of buying pressure.


WMT on the way to TP/ReentryPlease refer to our MMM (3M) analysis. Same condition. Make sure to apply set loss and take profit level to all your trade.


WMT breakout incomingWMT 4H | I like the way $WMT is looking. Setting my alerts for a potential breakout in the upcoming weeks. Potential call ideas is $145C 8/20 expiration.
Current Price: $140.82
Support: $139.91, $138.20, $136.78
Resistance: $141.02, $142.20, $143.25, $145, $147.85

WMT LongWMT can see a $10 push
- Holding on resistance and consolidating
- Edge of Wedge
- Ave low RSI
- Long on confirmed break of 141.01
- On rejection can move down to 136 levels


Walmart latest moves.Here, an amazing jump in price of Walmart. Crosses of price over the technical indicators, and the perfect trading picture of the move.


